Google Sites is a great way to organize information. One of the benefits of using Google Sites is to use visuals to more clearly communicate. Sometimes, those visuals are charts. Google Sites makes it easy to add charts to your Sites page.
The Answer is Always a Spreadsheet
Start with Google Sheets
If your chart is based off of data then Google Sheets is probably the best place to start! Organize your data and use the chart wizard to create a chart visualization.
Charts in Google Sites
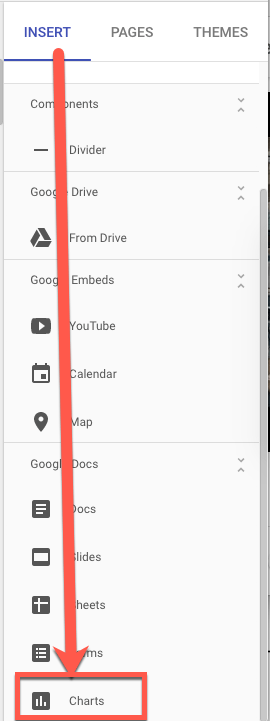
Back in Google Sites use the Insert sidebar to find “Charts” all the way at the bottom of the insert options. This will allow you to select a Google Sheets spreadsheet that has charts in it. Then you select which chart to insert!
Join Alice Keeler for this session for teaching with AI
Imagine having a team of teaching assistants who already know your syllabus and exactly how you like to give feedback. Join Google Certified Innovator Alice Keeler to learn how to use Google Gems to build a powerful collection of custom AI tools. We will explore how to engineer specific instructions so you can create a Grading Assistant or a Classroom Policy Manager that works for you. You will also learn how to leverage Gems shared by other educators to instantly expand your toolkit. This session is about super-powering your teaching by automating the routine tasks so you can focus on the students.
Exit this pop up by pressing escape or clicking anywhere off the pop up.