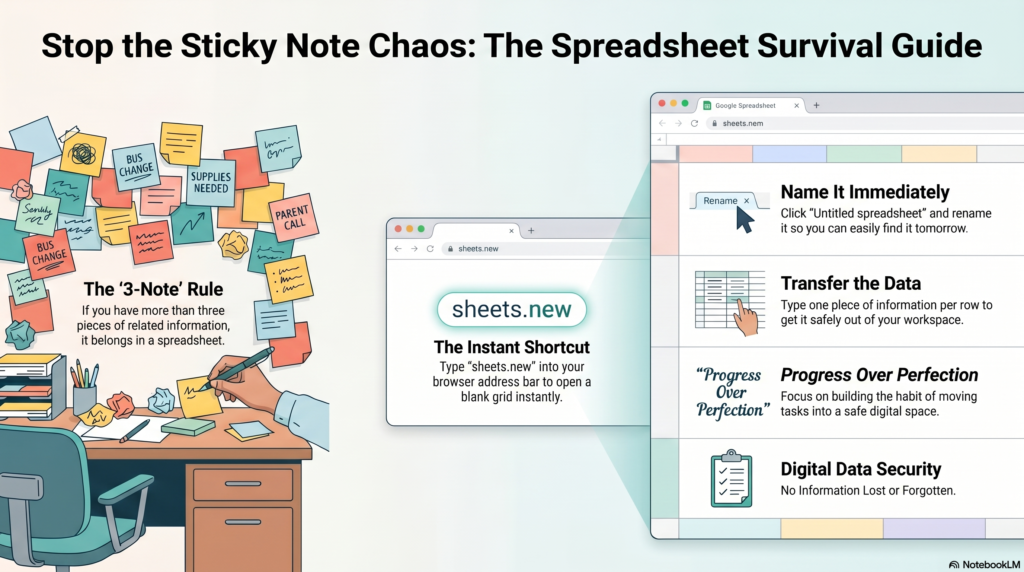
Multi-media and visuals improve learning. However, they are not always easy to make. NotebookLM is amazing for so many reasons, with quick Infographics being one of them. While you love the ability to make an infographic… it just isn’t quite right. How can you can further customize the infographic? (Spoiler, app smash with Canva.)
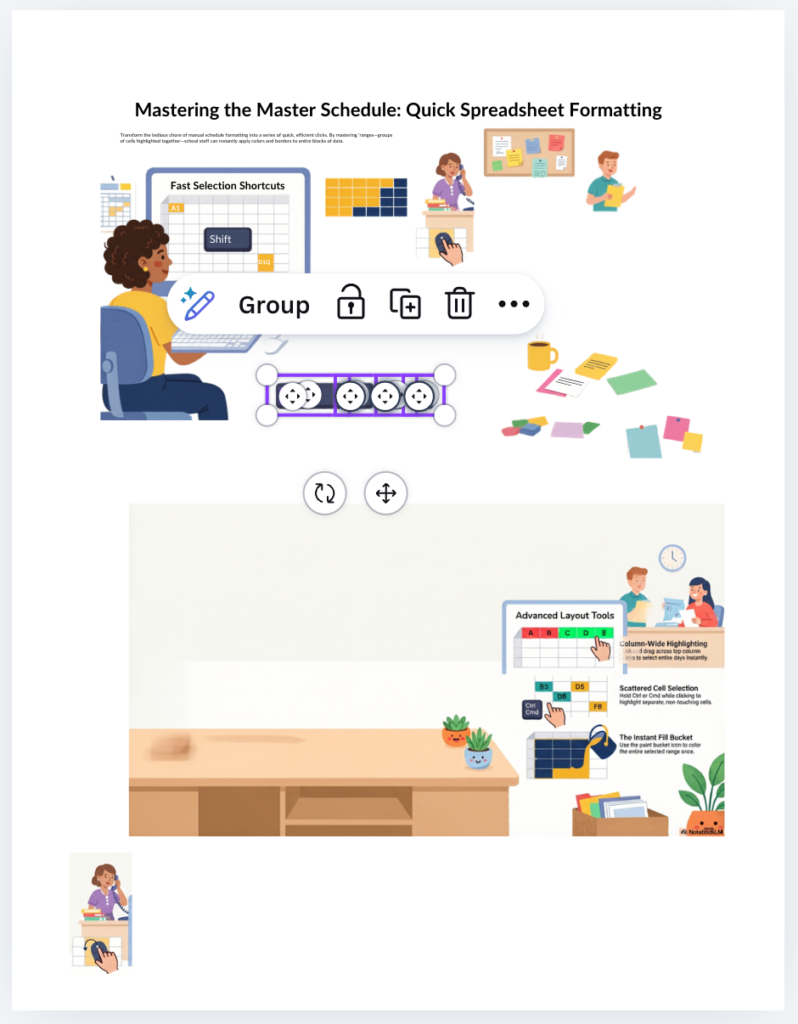
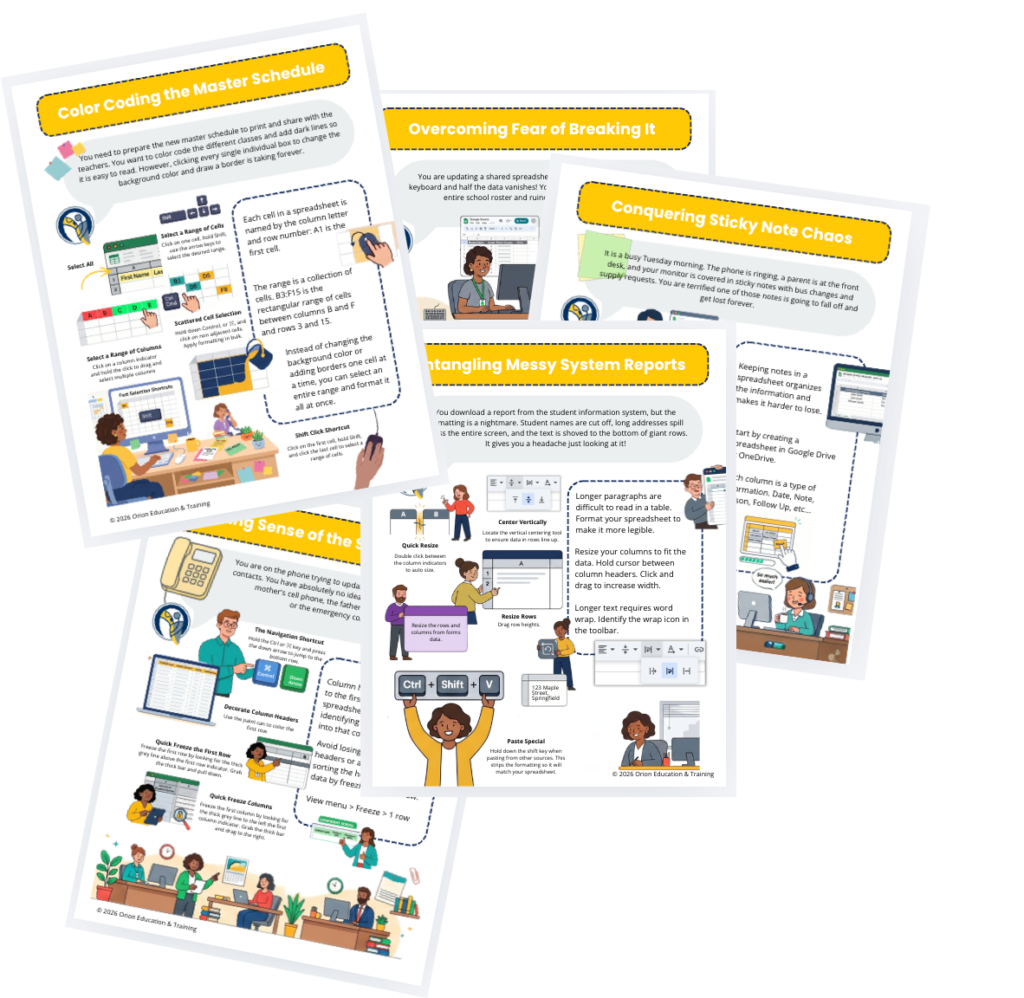
I added spreadsheet tips to a NotebookLM notebook and asked it to visualize it for me.
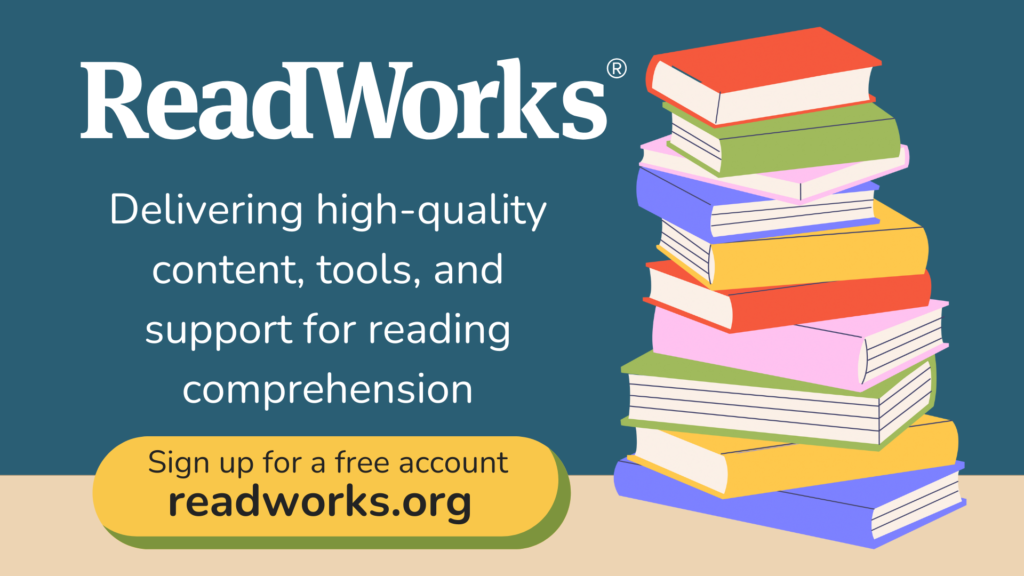
Delivering high-quality content, tools, and support for reading comprehension
ReadWorks is a free, research-based website designed to support educators in teaching reading comprehension across grades K–12. It provides a rich library of high-quality, standards-aligned instructional content.
NotebookLM requires you to add sources in order to use the AI. This ensures that the output is strictly based on the sources you trust. This makes for much better graphics to provide your students.
Try Copied Text
When adding sources, there is an option for “Copied Text.” I use this to type out all the facts and information I want in my infographic rather than letting NotebookLM to guess which parts of my sources it wants to include in the graphic.
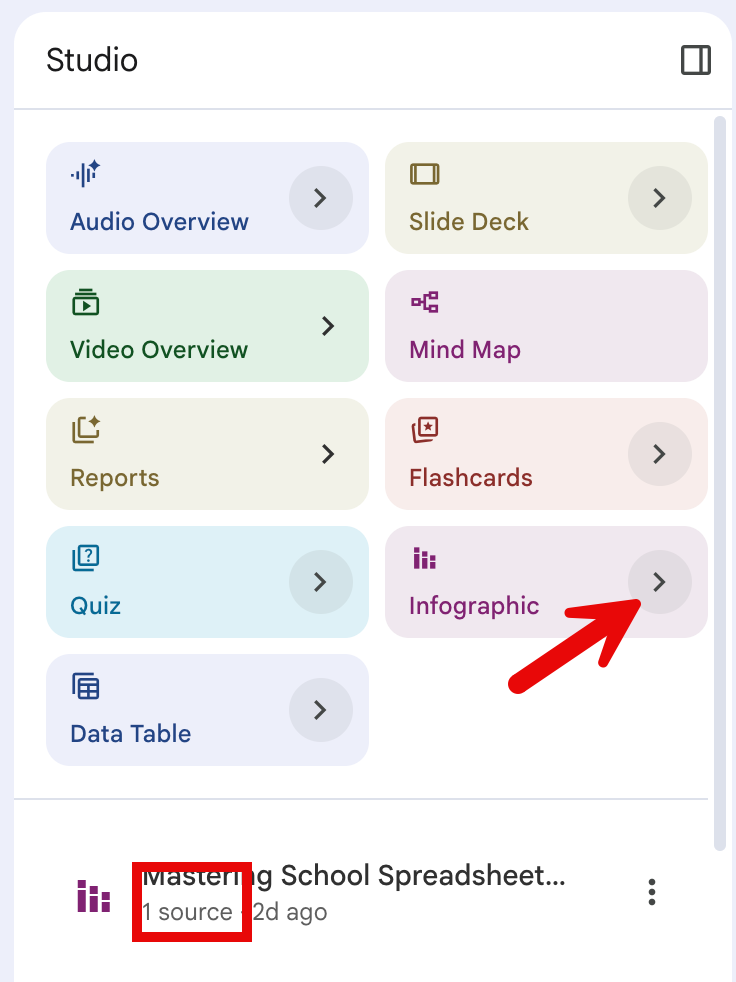
Checkbox Your Source
When creating infographics, or other resources in NotebookLM, you can select a subset of the sources. If I used the Copied Text or turned a chat response into a source, I will check the one source that has the content I want in my graphic.
Customize the Infographic with Canva
Canva allows me to create edits and add my own touches to the infographic I created in NotebookLM. After downloading the Infographic image, I add it to a Canva project. (Tip: use an 8.5 by 11 size project to make it easy to print.)
I add a blank page to allow me to use the space to edit the image. I will copy and paste the edited elements onto the actual page that I plan on using. Add the infographic to the blank page more than once to allow you to crop out individual elements of the graphic.
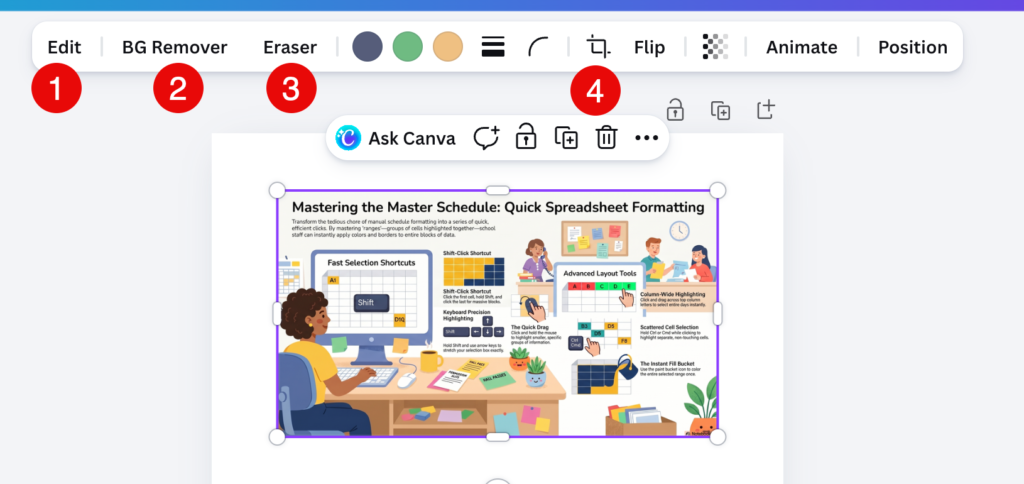
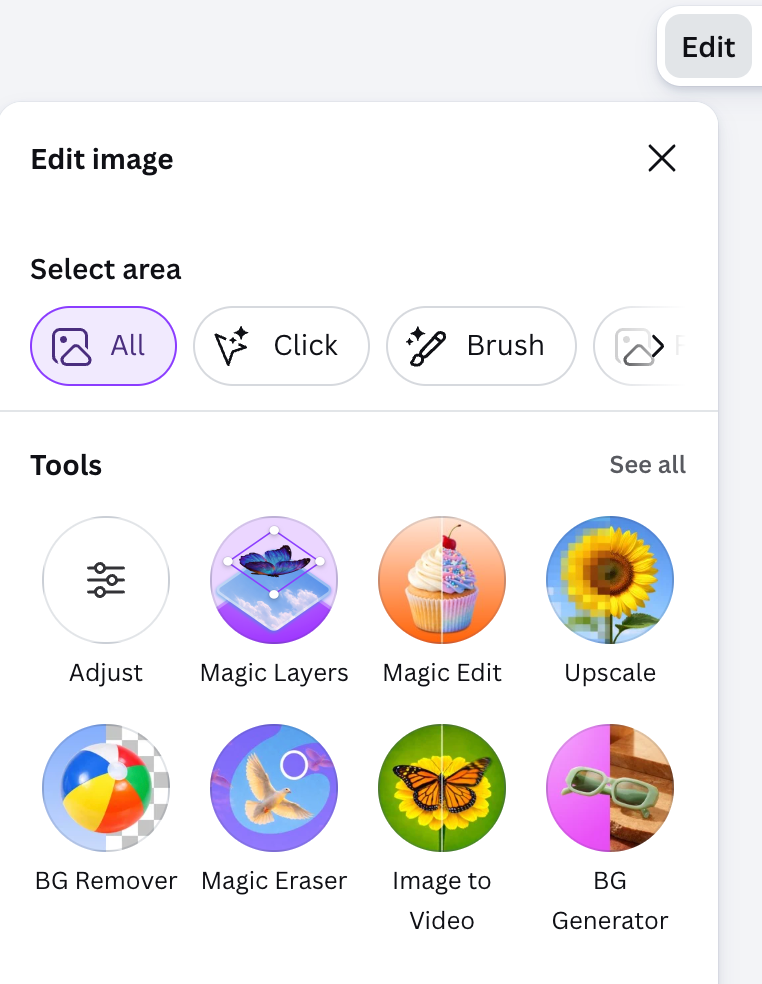
Choose Edit for multiple editing options.
Try Background remover to make it easier to crop and fit the elements into your customized background.
Erase out elements of the infographic you don’t want.
Crop the image to just a single element of the graphic.
Use AI to create lesson plans, rubrics, newsletters, anything you want.
Educator AI Assistant is different by collecting ZERO data. Shows you the prompt and allows you to edit and share.
Runs locally in your own Google Sheets™.
Fully transparent and customizable.
Created by AliceKeeler
Try Magic Layers
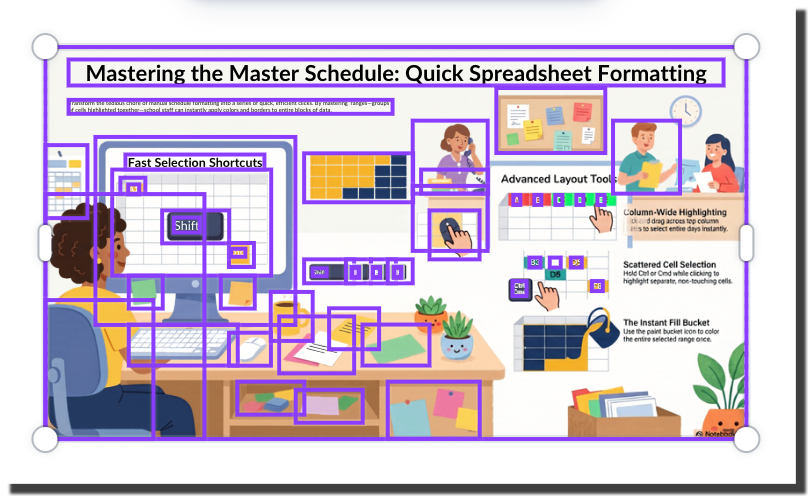
Selecting Edit will give you multiple options that are very helpful. However, Magic Layers is a huge time saver. It will separate out the graphics to individual graphics and turn the text into editable text. It isn’t perfect and you may need to manually group elements together that didn’t need to be separated.
Notice Magic Layers has all the elements in the bottom right grouped together. Not perfect, but still helpful. TIP: Hold down the Shift key to multiple select elements to group them together.
Copy paste the elements that Magic Layer helped you with to your infographic page. From the Uploads tab on the left, add the infographic back to the editing page to continue to crop out elements.
Create More Graphics
Some of the graphic elements in the NotebookLM infographic might not be what you needed for your final infographic. You also might need additional graphics. However, you want a cohesiveness to your final product.
Leverage Google Gemini
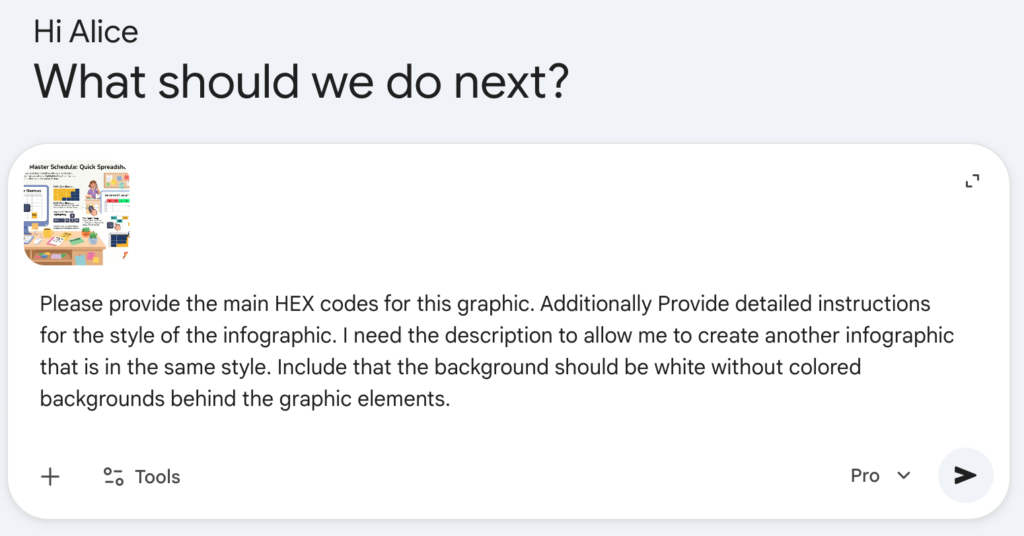
In Gemini chat (gemini.google.com) drag the original NotebookLM infographic into a conversation.
Please provide the main HEX codes for this graphic. Additionally Provide detailed instructions for the style of the infographic. I need the description to allow me to create another infographic that is in the same style. Include that the background should be white without colored backgrounds behind the graphic elements.
Create Another Infographic
Using the same source or create a new source in NotebooLM that describes information for your infographic that you need graphics created for.
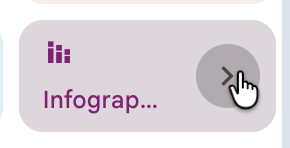
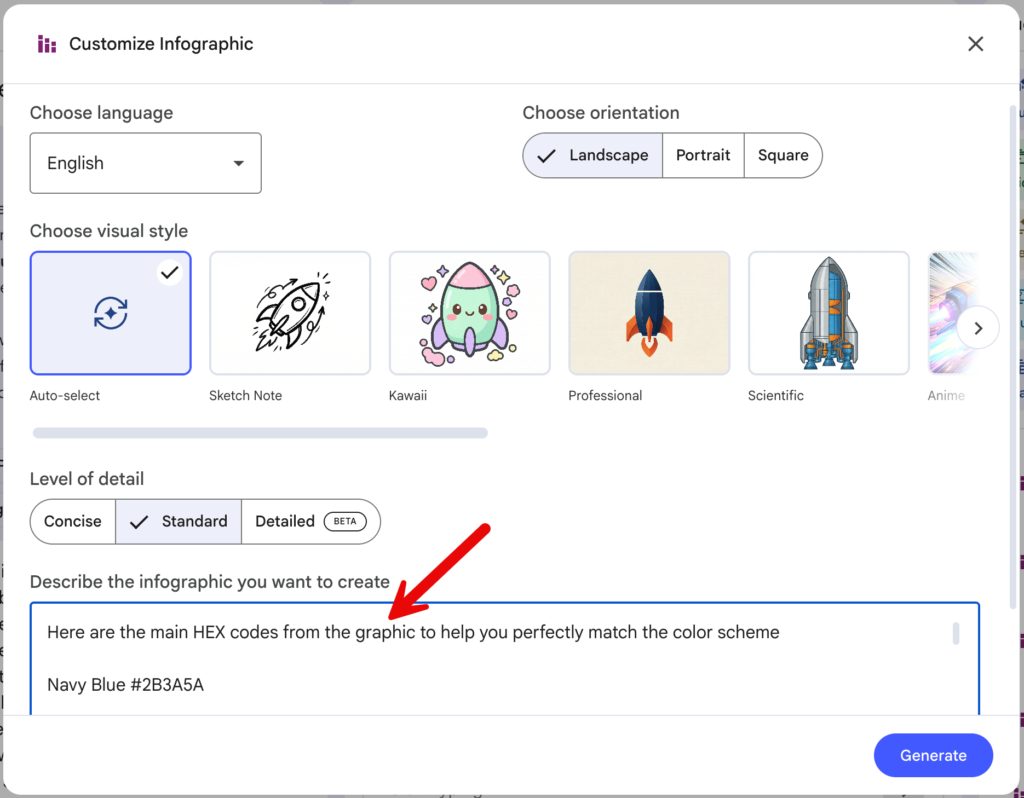
Click on the arrow on the Infographic tile. This provides a box to describe the infographic you want to create. Paste the instructions that Gemini provided to help you maintain consistency.
Repeat Repeat Repeat
Suggestion, do not use the text boxes created by NotebookLM to allow you to have consistency and control over the content. Continue create infographics, but paste the same style guide you created in Gemini.
Caution: 3 Infographic max per day.
NotebookLM on the base level (not upgraded) only allows you to create 3 infographics every 24 hours. Hint: Share the notebookLM with someone to allow them to create additional infographics if needed.
Example
Notice that I made a template for myself in Canva with a consistent heading. As well as spots to enter text. Copying the template page allowed me to paste in elements from the infographics I generated, and have a consistent overall product.
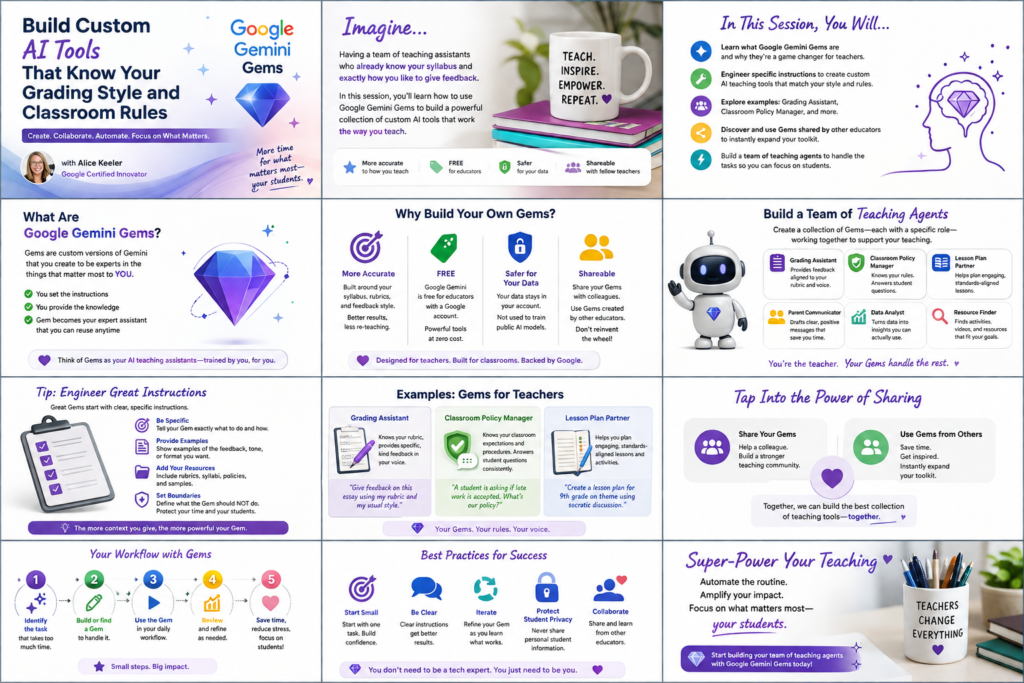
Join Alice Keeler for this session for teaching with AI
Imagine having a team of teaching assistants who already know your syllabus and exactly how you like to give feedback. Join Google Certified Innovator Alice Keeler to learn how to use Google Gems to build a powerful collection of custom AI tools. We will explore how to engineer specific instructions so you can create a Grading Assistant or a Classroom Policy Manager that works for you. You will also learn how to leverage Gems shared by other educators to instantly expand your toolkit. This session is about super-powering your teaching by automating the routine tasks so you can focus on the students.
Exit this pop up by pressing escape or clicking anywhere off the pop up.