Free Resources for Preparing for Google Certification Training
I saw on Facebook someone asking about training so they can pass the Google Certification test. Google provides a free training course that in theory should be sufficient for passing the test. Here are the resources shared in the Facebook post along with my own tutorial on Pivot Tables since I have heard several people over the years wish this was covered better before they took the test.
Lindsey Allbright I just used the free training modules from Google and then took the Level 2 exam while everything was still fresh and passed.
Google Certification Page
Free Google Training Course
From the certification page you can link to the level 1 certification fundamentals training.
Checklists
A Google Search for Google Certification checklists pulls up several resources.
Here is a Google Doc by Eric Curts with an extensive checklist for level 1 certification.
Eric Curts also has an extensive checklist for level 2 certification in this Google Doc.
Kim Mattina has Google Slides study guide.
Kasey Bell has a free checklist matrix you can download.
John Sowash has 10 certification tips on this site geeducator.com
Here is a blog post of helpful information by Jennifer Scott on Slidesyearbook.com.
Lynne McKnight Herr bit.ly/esu6google – Lots of free resources in the first section of the doc. We use this document with teachers and pre-service teachers who are working on their certification.
YouTube
Several people in the Facebook thread indicated they searched YouTube and found several free courses. Since I have not watched any of them I won’t recommend any in particular.
Tip: Click the settings cog in the bottom right of the YouTube video to choose “Playback speed.” Set to double time if you want to get through them faster.

Pivot Tables
I love love love Pivot Tables. I honestly think a data and spreadsheet class should be required for all teacher prep programs. This would make our jobs so much easier as we are asked to be data driven.
A Pivot Table summarizes data.
Pivot Table Data
I have a spreadsheet of some sample data for you to play with.

On the first tab, highlight the 3 columns of data. You can NOT select all. You will need to specifically highlight the columns of data you want to include.
Data Menu
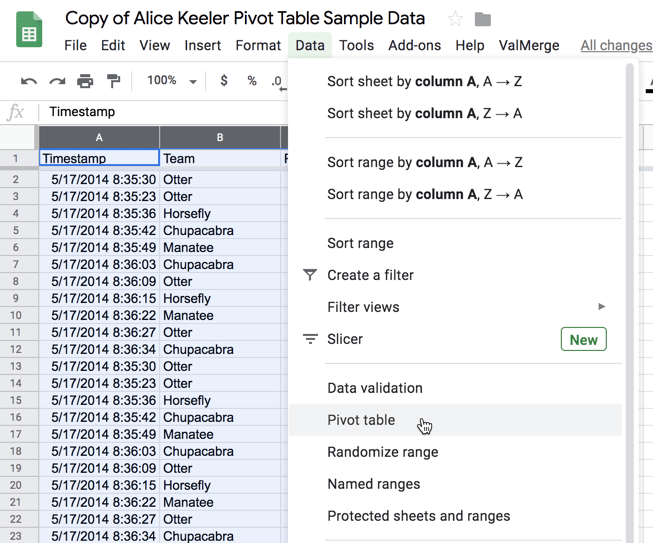
Once the columns are highlighted, use the Data menu to choose “Pivot table.”

You will be given the option to create the pivot table in a “New sheet” or an “Existing sheet.” I always choose new sheet.
Pivot Table Editor
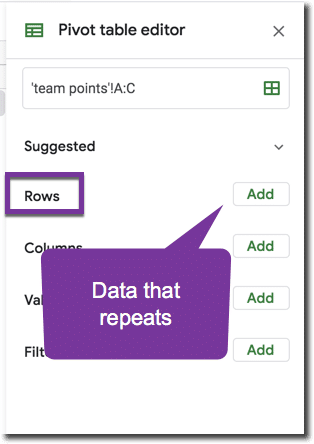
On the right hand side is the pivot table editor. Start by clicking “Add” for “Rows.” This will give you a drop down list to choose the column you want to summarize.

You want to choose a column that has repeating data. For example: Students check into the library and choose who their teacher is. You want to summarize by teacher. Students also go to the library more than once, so instead you want to choose the column with student name to summarize how often students are going to the library.
Another example: Students take a quiz in Google Forms. You want to know how many students chose a particular answer for the question.
Values
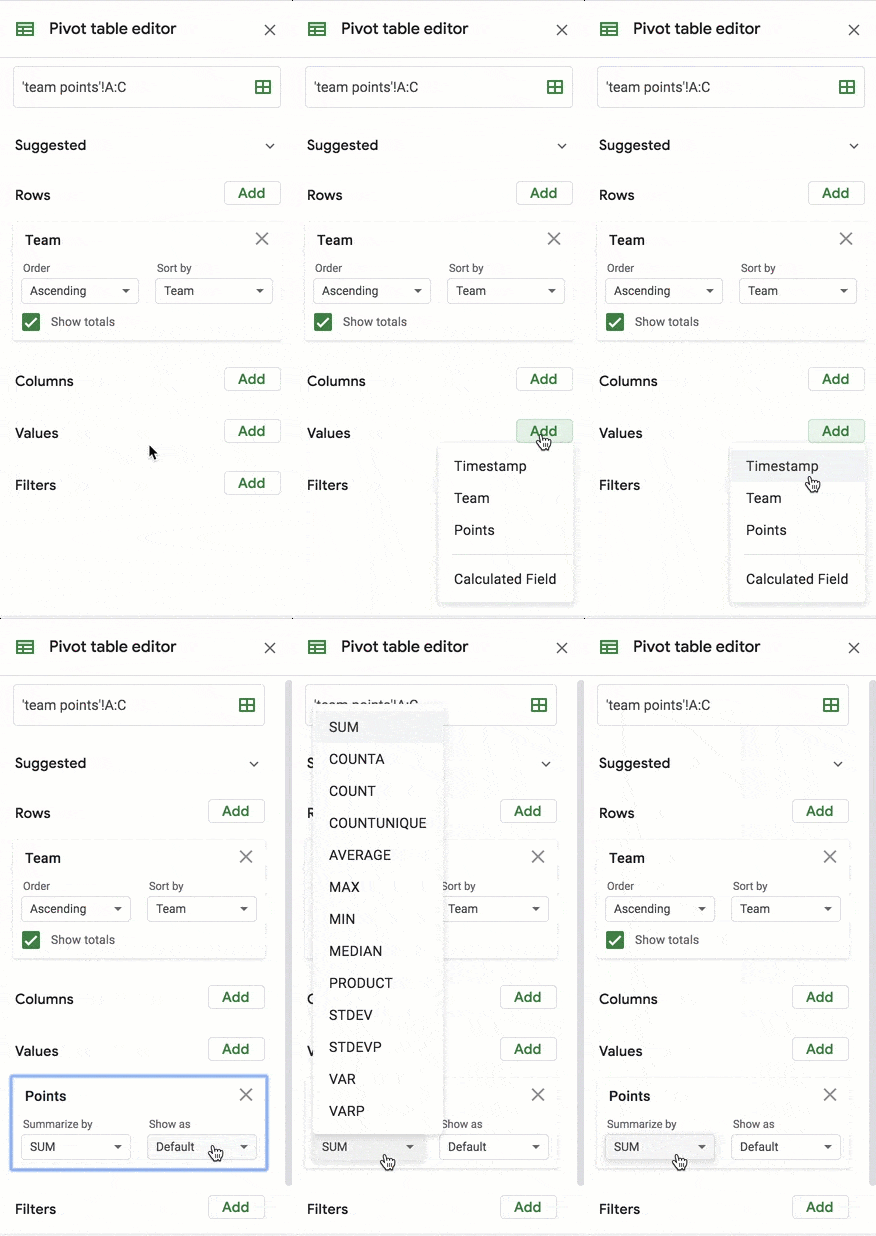
For a simple pivot table, jump to adding values. Select the column with data that has “math” done to it. You want to know how many times a student went to the library, then you want to count timestamps. You want to add points over multiple assignments taken by a student? Then you want to sum overall score. The “Values” lets you “Add” the column you want to count, sum, average, etc… it guesses what “math” you want to do with the data. Click on the “Summarize by” drop down to customize.

Note: The difference between COUNT and COUNTA is that COUNT counts numbers and COUNTA counts alphanumeric. I almost always choose COUNTA since it also counts numbers.
Columns
A more complicated pivot table sorts 2 ways.

On the “Form responses” tab of the spreadsheet I have sample peer evaluation data of a video project. These are not real student names or emails.
Highlight the columns of data and use the Data menu to choose “Pivot table.” In the Pivot table editor, click on “Add” for the “Rows” and choose the column of data you want to see information summarized by. For peer evaluation you may want to know the scores of who was evaluated OR how the reviewer scored the projects.
Under “Values” click “Add” to choose the column that you want to do “Math” on. Sum, Average, Max, Count, CountA, etc…
Columns
Click on “Add” for “Columns” to further organize and summarize your data. You want to choose a column that has repeating data also. For example: Students choose a rating of 1 – 5 for the peer evaluation. The only choices are 1, 2, 3, 4, or 5. These unique values become the column headers in your pivot table.

Make Another Pivot Table
Go back to the tab with the data and use the Data menu to choose “Pivot table.” Create another one where you look at the data another way.


