


Laurie Anastasio tweeted that she was creating a line graph for tracking photoperiod/daylight to prepare for a project with Journey North. The problem was that the chart wizard was not able to read her data. View Laurie’s data: CLICK HERE
Extra Columns
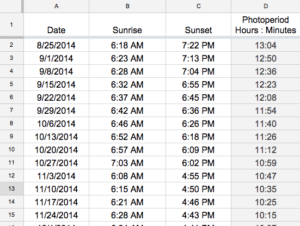
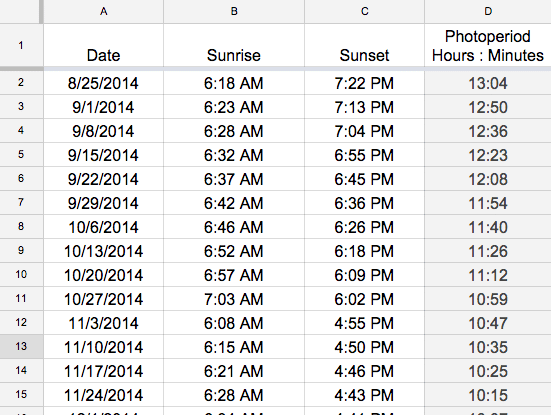
When you highlight your data to use the chart wizard in Google Sheets you want to exclude extra columns. In the case of Laurie’s data she has the hours of Sunrise and Sunset that are not graphed but are part of the range that includes date and hours of the photoperiod.
One solution is to duplicate the sheet and delete the extra columns to create the chart. The problem with this is if you update your data on the first tab that does not effect the second tab.
Data Type
Another problem Laurie had was her time was written in hours and minutes separated by a colon. This is not a numerical value that can be charted.
Solution
When your data columns are not set up for charting (such as when you have information from a Google Form) create a new tab. CLICK HERE to see the solution data.
ImportRange
If you use the formula =importrange(“spreadsheet URL”, “Data Range”) you are able to write formulas on the data and in the case of your original data being from a Google Form that it will update as there are new form submissions.
In cell A1 I typed the formula
=importrange(“https://docs.google.com/spreadsheets/d/1k8fa13EcmFwVcmDODlH4lgyvNtHK3VAMz3TBio_yOXc/edit#gid=476577544″,”San Marcos Daylight!A2:D40”)
Remember to put the quotation marks around the spreadsheet URL. I am importing data from the same spreadsheet so I simply copied the URL from the top of the screen.
The data is on the first tab which has the name “San Marcos Daylight.” The data range is written in quotation marks with the name of the tab and then an exclamation mark and then the range of the data. In this case the data to be charted was from cell A2 to cell D40.
=split()
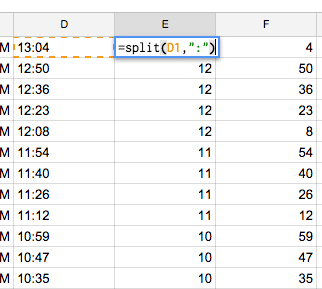
In column E I needed to split up the hours and the minutes that were in column D. Use the formula
=split(D1,”:”)
This says to take what is in cell D1 and break it up wherever there is a colon. Make sure you place the colon in quotation marks. Copy the formula down so that all of column D is split up by hours and minutes.
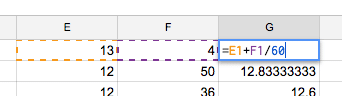
To convert the minutes to hours, divide the number of minutes by 60.
In column F I added the number of hours to the number of minutes converted to hours. I used the formula =E1+F1/60.
Bring it Together
I now have a lot of columns that are not necessary for my chart. What I can do in this case is use the equals sign to copy the columns I need to chart to the end of my data. I need column A and column G for my chart.
In cell H1 I type
=A1
And in cell I1 I type
=G1
This simply takes whatever is in A1 and whatever is in G1 and puts it into the new columns. Copy and paste the formula down the sheet to reflect all of the data in columns A and G.
Alternatively
Instead of creating two new columns for the data you can select your ranges manually in the chart editor. Under the start tab next to the data range it says “Select ranges…” Click on this to edit the data range for the chart.
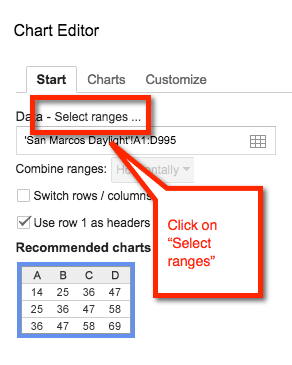
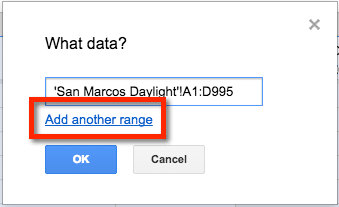
Edit the range to just be one column of data. Click on “Add another range” to highlight a second column of data. The first data range can be your x axis values and the second data range can be your y axis values.
Highlight the Data
To use the chart wizard first highlight your data range. In this case it is cells H1 to I40.
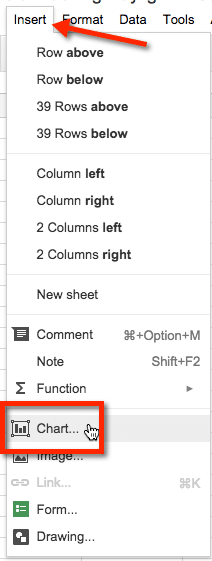
Insert Chart
Use the chart wizard icon in the toolbar or use the Insert menu to insert a chart.
Default Chart
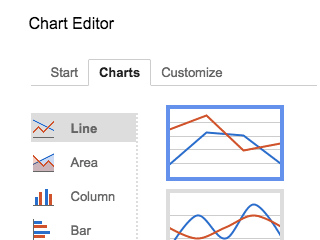
Google Sheets will recommend a chart for you. In this case we want a line graph which is not the suggested chart.
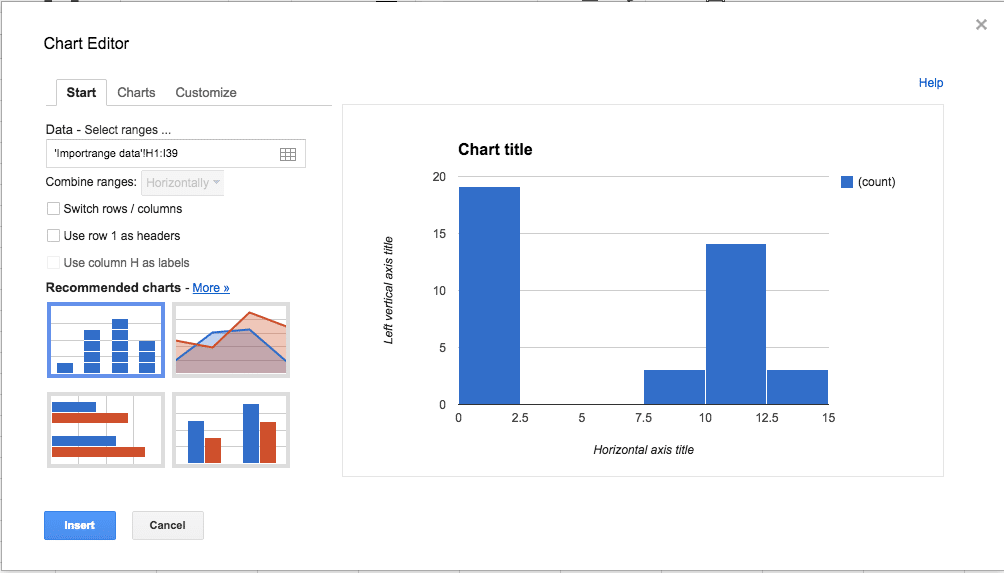
Click on the charts tab to manually select the line graph. Click insert.
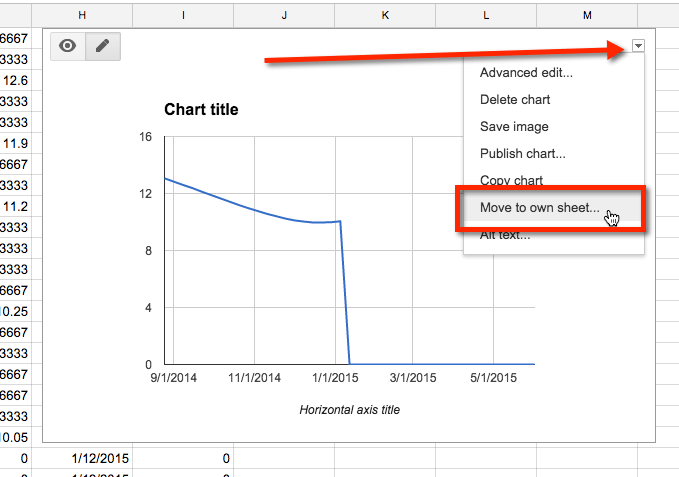
Move Chart
The chart will be inserted as a floating window on the sheet. If this is not what you want you can move the chart to it’s own sheet. Click on the chart and notice there is a small arrow in the upper right hand corner. Click on this arrow to reveal editing options. Choose “Move to own sheet…”
Auto Update
The chart will automatically update as data is added to the first tab.