
Design Your Own Infographics Report Card
I saw on Twitter that @teachtech4kids was thinking about creating an Infographics report card. BRILLIANT! I got sucked into the idea immediately and started to create a template to help facilitate that. The problem with a traditional infographic is that you’re going to have to make a copy per student and put in the info one at a time. Worth it but since I like to make my Infographics in Google Slides I thought, I can code this to make it easier.
What are your favorite apps/sites for creating infographics? I want to create an infographic for each student to go with their report card instead of written comments. #tlap #learnlap
— AnnMarie Dahl, NBCT (@techteach4kids) January 18, 2019
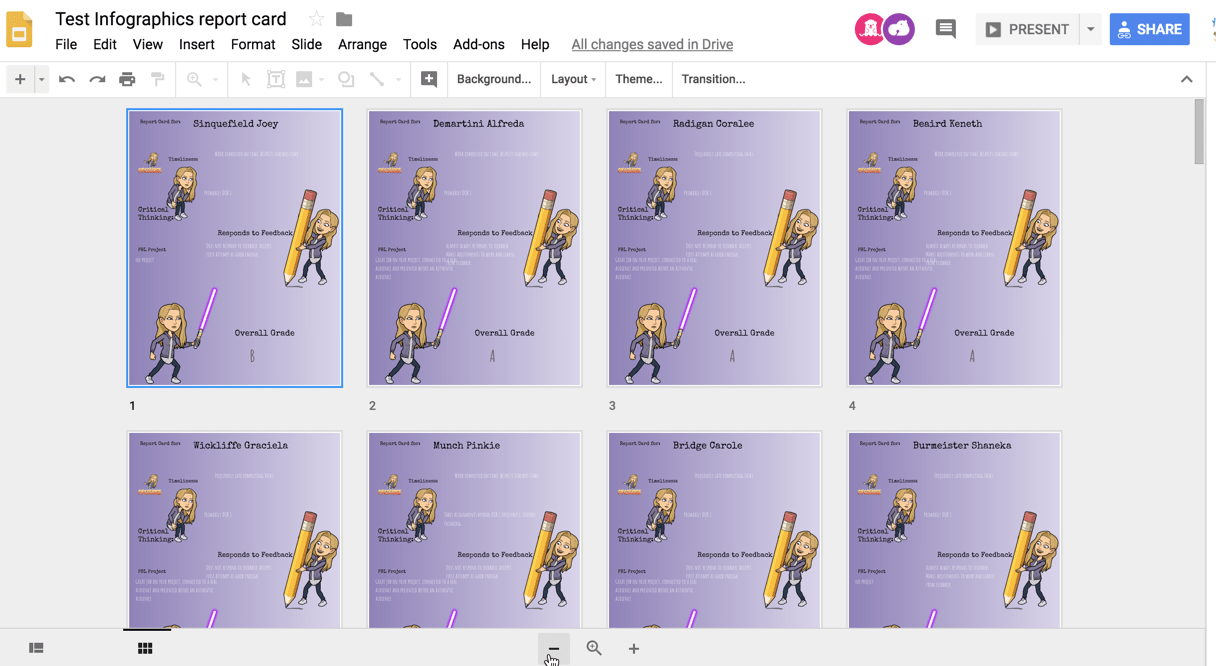
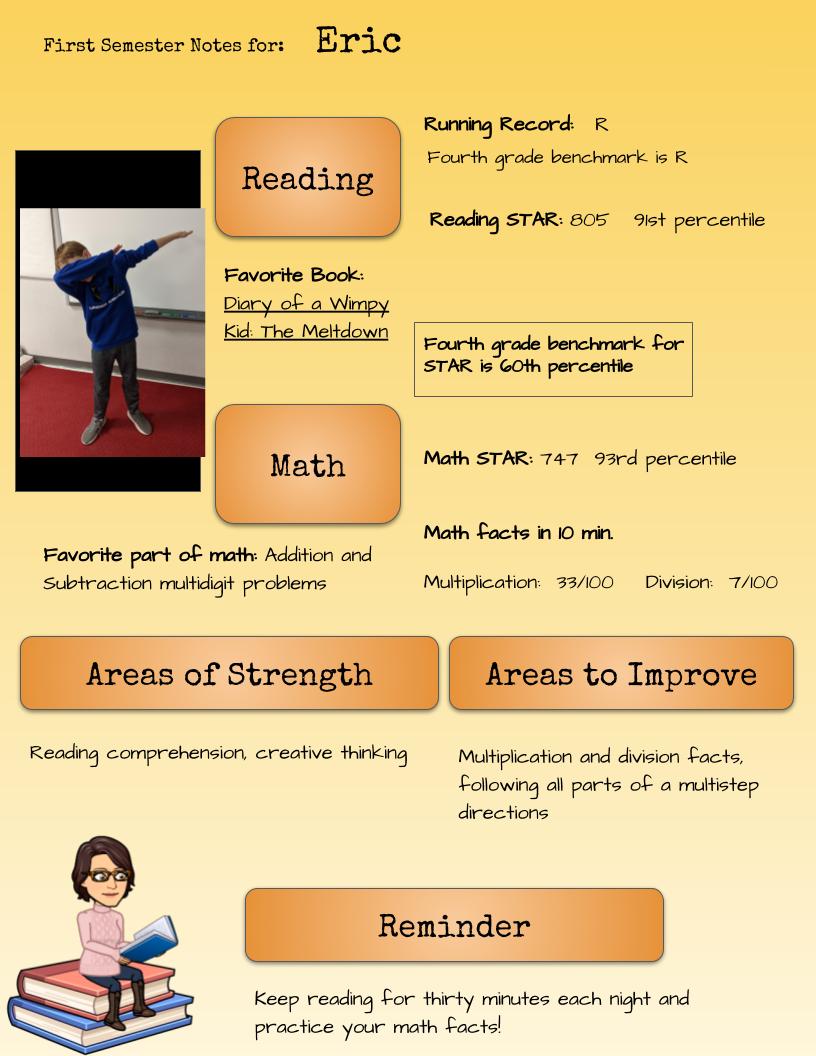
Template
Sample
Sample Spreadsheet and Sample Google Slides Report Card
Start with the Spreadsheet
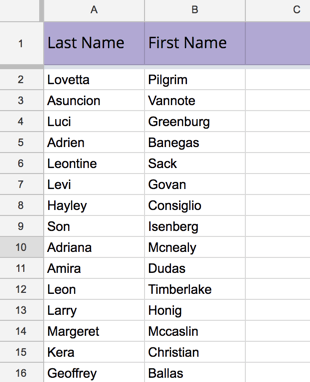
The spreadsheet template allows you to copy your roster into Columns A and B. I have it set up so if you use Google Classroom you can copy and paste from the spreadsheet export.
Use the Menu
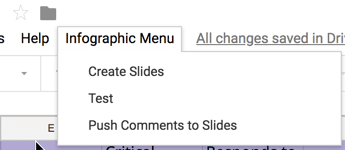
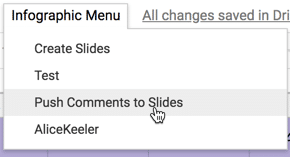
Next to the help menu, it should say “Infographic Menu.” Click on “Create Slides.” It can take a few seconds for the menu to appear.
Authorize the Script
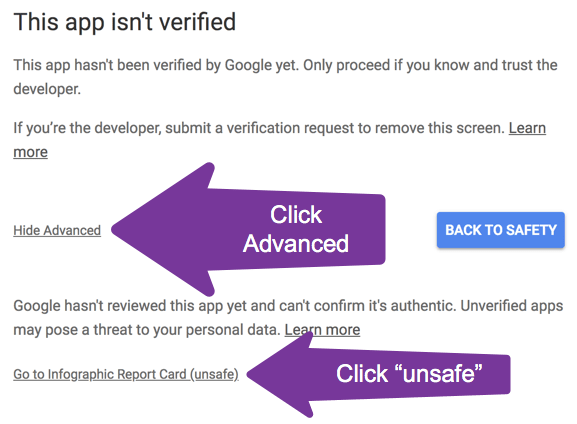
I personally coded this Add-on. It is safe. The permissions screen may show you a warning screen with a big “Back to safety” button. Click on the small text “Advanced” and then at the bottom Google is letting you know they have not reviewed the code and are calling it unsafe because it has not been inspected. Click on “Go to Infographics Report Card (unsafe)” (it’s safe!)
Slides Link
On the 2nd tab, you have a link to a Google Slides template in cell C1. Click on the link to launch the slides.
Note that you can put any link to any Google Slides into cell C1 on the Google Slides tab in the spreadsheet and this will merge what is on your spreadsheet to each placeholder text in the Slides.
View Menu
Use the View menu to choose “Master.”

Edit the Layout
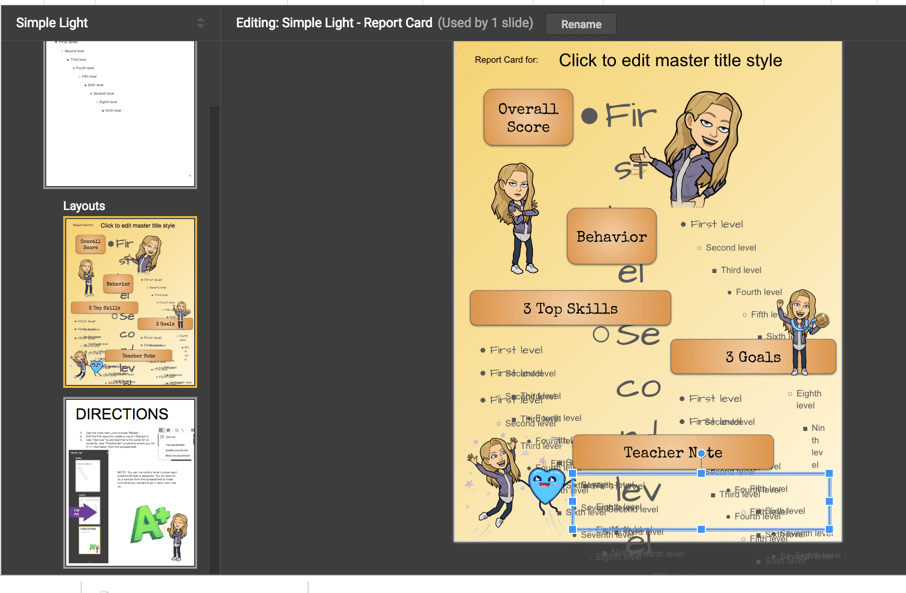
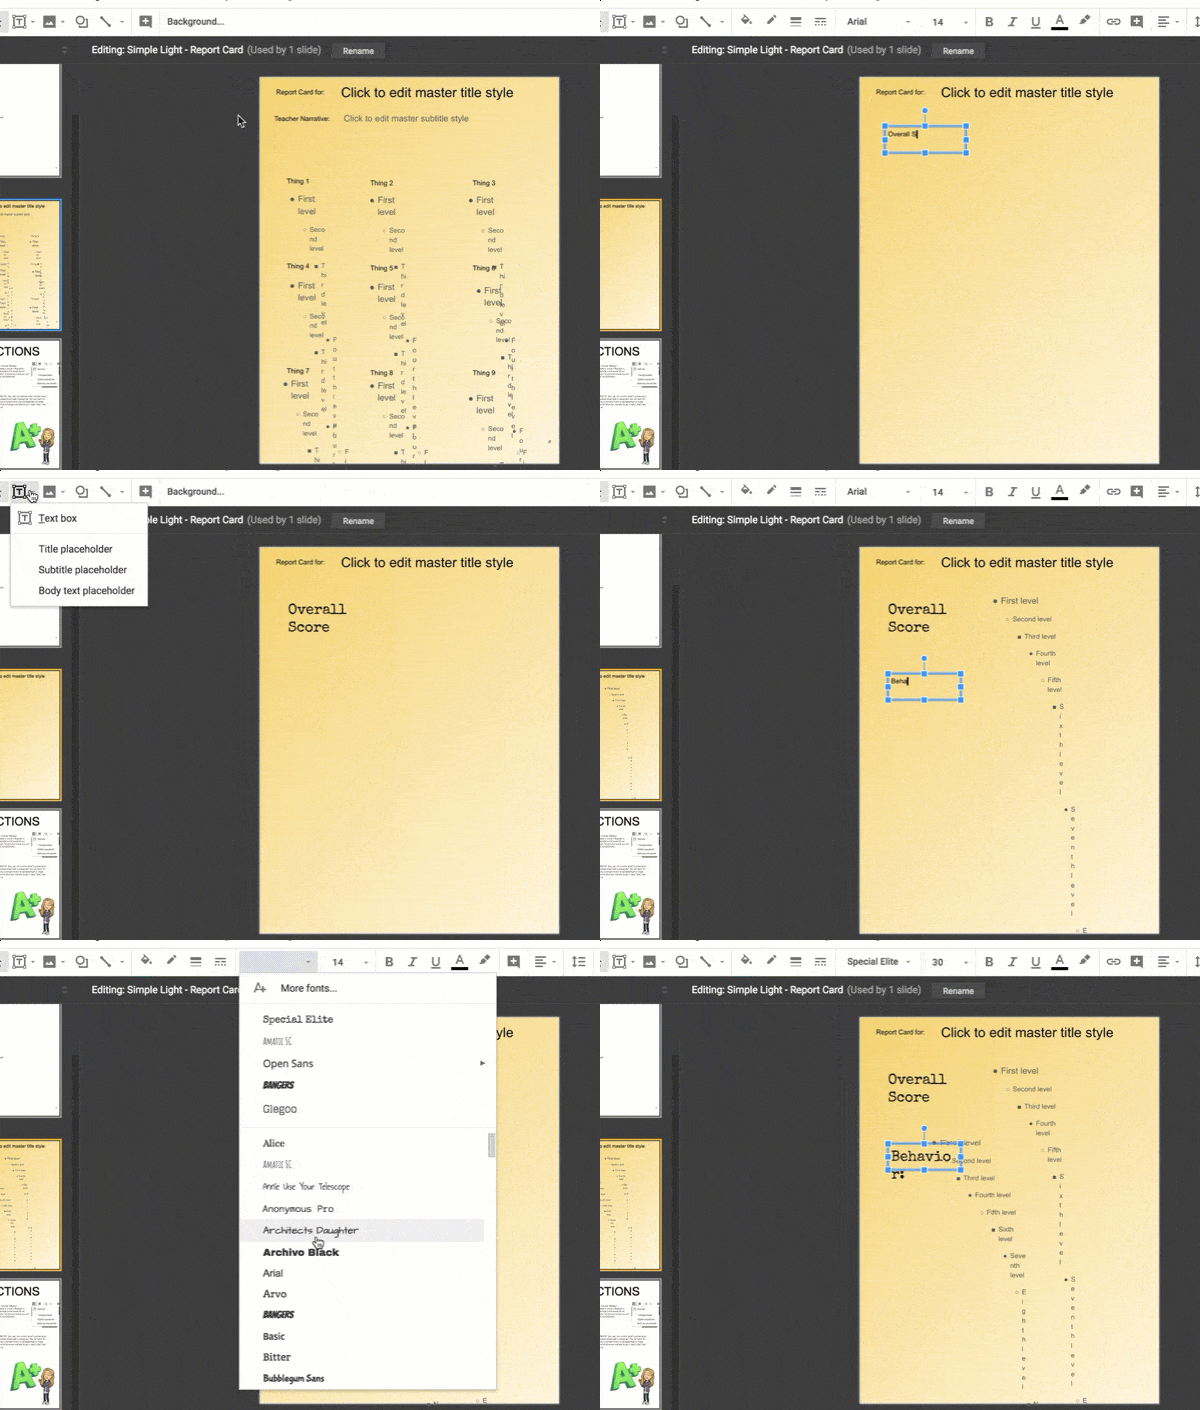
On the Slides Master, edit the report card layout. You can design it however you wish.
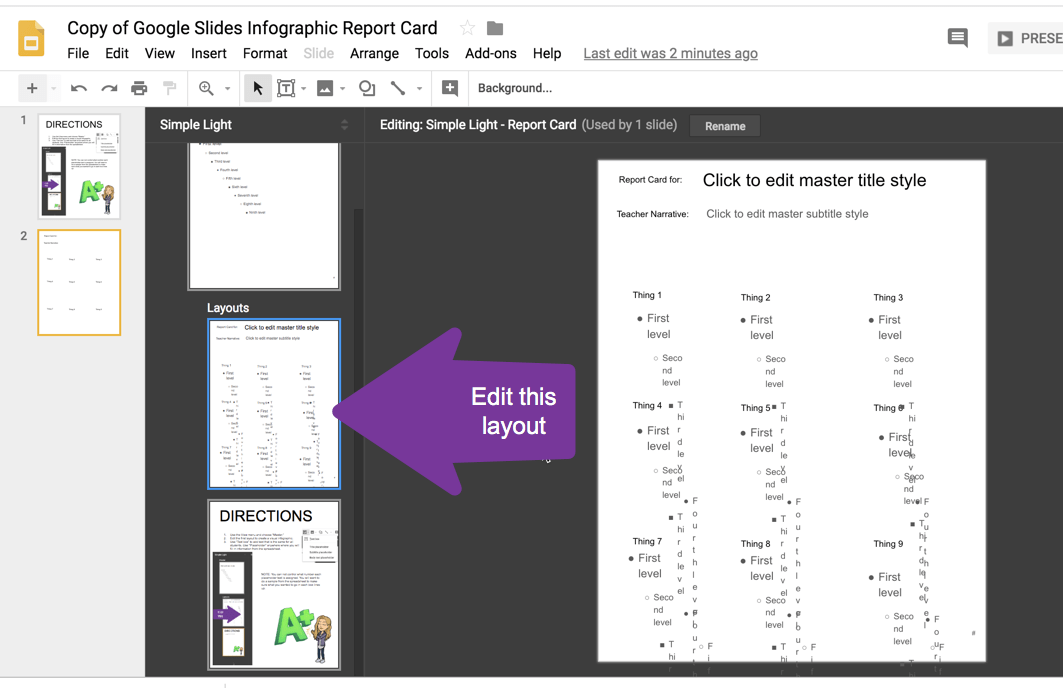
Name Spot
The title placeholder at the top is where the student’s name will go. I recommend you do not delete that placeholder. You can move it, change the font size, or color.
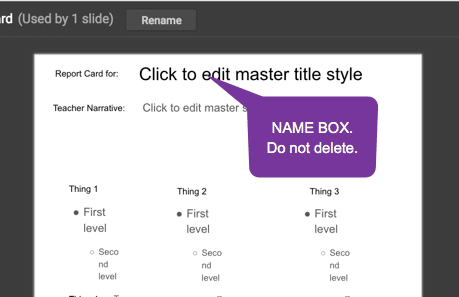
Gradient
This is definitely not required but one quick way to make your infographic not feel boring is to change the background. Gradient is fun. Click on the Gradient tab and choose one. Go back and select gradient again and click on “Custom” to customize your gradient.
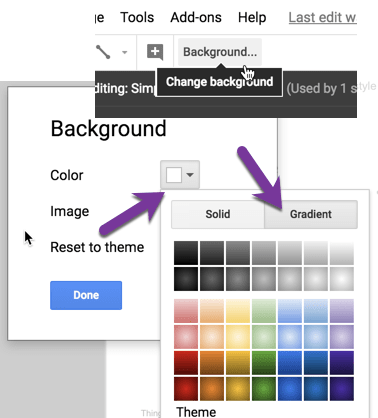
Textbox and Placeholder
You want to design your report card using textboxes and placeholders. In the toolbar notice the tiny triangle next to the text icon. The first option is “Text box.” This is text that is locked down. What do you want your report card to say on every student’s report card?
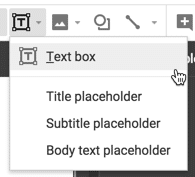
The Title placeholder, Subtitle placeholder, and Body text placeholder are for where you will merge what is on the spreadsheet that is specific to a student into the report card.
You can delete the textboxes and placeholders I have on the template. Suggestion NOT to delete the title placeholder I have for name. Add your own textboxes and placeholder textboxes.
Add Images and Graphics
This is an infographic. Add shapes and images to your report card.
Paste Your Roster
Back in the spreadsheet, paste your roster onto the Google Sheets.
Test
BEFORE you put in any student data, first test to see how the spreadsheet will merge with the Google Slides. Use the Infographic Menu and choose “Test.” 
This will add one test slide to the Google Slides. Notice in the spreadsheet the column headers say “Box 1,” “Box 2,” etc… The test slide takes those column headers and puts them into your textboxes on the slides so you can match them up.

Notice in my example that where I intended to put “Overall Score” it says “Box 9.” Back in the spreadsheet I find the column for Box 9 and replace it with Overall Score.
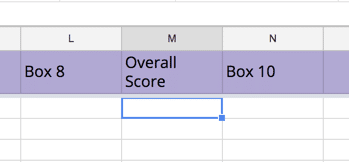
TIP: Do not make your column headers and then try to make your Google Slides match the spreadsheet. It is much easier to see where each column maps to in Google Slides and then put in the column headers into the spreadsheet.
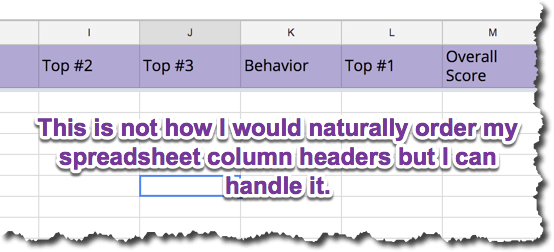
Notice the 3 placeholder textboxes I have under 3 Top Skills are “Box 8,” then “Box 5,” and then “Box 6.” That was unexpected. You really have no control over which placeholder will be assigned what number. This is why it is important to run the text to see how they map.
Fill in Student Data
Now that the textboxes in Google Slides match your spreadsheet columns, fill in the information for each student. This will be much faster than trying to fill in textboxes by hand for each student if you were to make infographics one at a time for each student.
Use Tab
Spreadsheets are designed for TAB. Enter a piece of information for one student and instead of using the mouse or arrow key, hit the Tab key to move to the next column.

Tip: Shift Tab will send you to the left instead of the right if you need to back up.
Push Comments to Slides
When you are done putting in the comments for each student, go back to the Infographic Menu and choose “Push comments to slides.”
Check the Google Slides
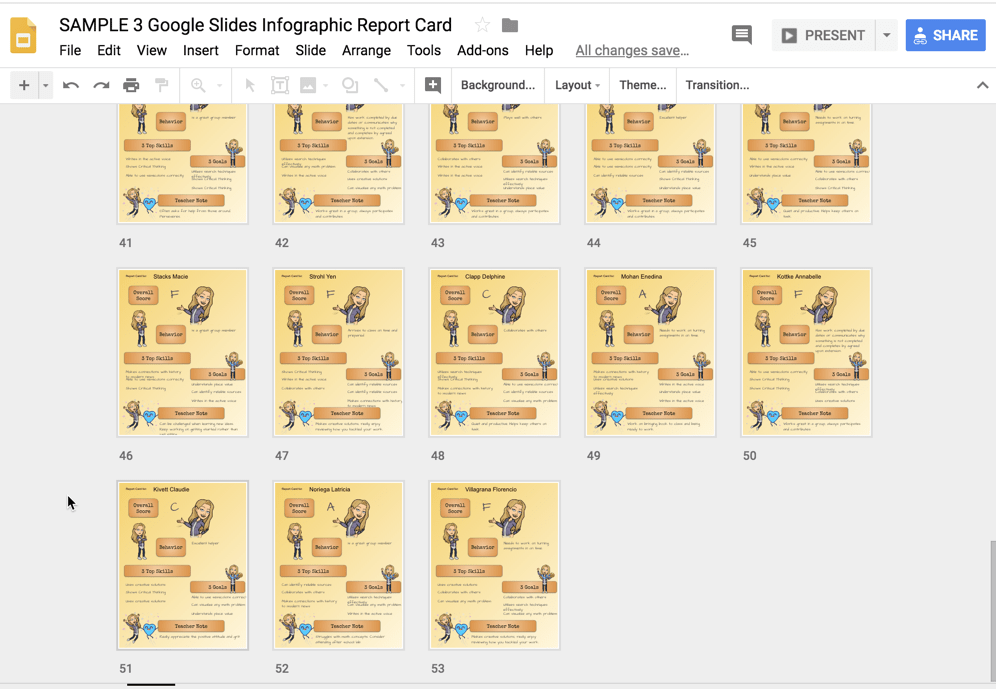
A slide per student should have been added. Check that the information merged correctly from the spreadsheet to the Google Slides.
Edit the Slide Master
If you notice some of the text does not fit or other adjustments need to be made in the Google Slides you do not have to start over. Use the View menu and choose “Master.” Any updates you make to the Slide Master will universally apply to all of the slides.
Print Infographics
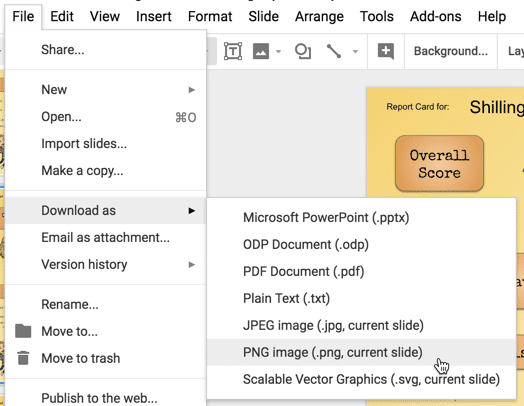
Obviously, you would not share the report cards of other students to the class. You will want to either print out the infographics and give them to your students or download them digitally. Use the “Download as” option under the File menu to download digital images of the report cards.





1 thought on “Create an Infographics Report Card”
This looks great. I love the step by step for people! Thanks again!