Visualizing is an important strategy for tackling math problems. Tape diagrams offer a versatile visualization tool that can be introduced to young learners and remain useful throughout high school. While paper tape diagrams are excellent, a digital approach sometimes offers advantages. Here are some tips for students to create digital tape diagrams:
Examples of Tape Diagrams
Tape diagrams look kinda like a piece of tape. A set of rectangles is created to represent the math problem.
Sarah has 5 stickers. Her friend gives her 3 more stickers. How many stickers does Sarah have in total?
“Sarah has 5 stickers.” This is part of the total. A rectangle as part of the whole is represented for the 5. “gives her 3 more stickers” adds to the total number of stickers. An additional rectangle completes the model to represent the 3 more. A question mark over the total represents what is being asked.
A farmer plants 4 rows of carrots. There are 6 carrots in each row. How many carrots did the farmer plant?
Students will visualize 4 rows, each labeled 6.
Washi tape in FigJam
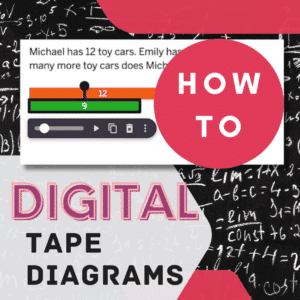
Michael has 12 toy cars. Emily has 9 toy cars. How many more toy cars does Michael have than Emily?
Comparing the quantity of 12 to 9.
A cake is cut into 8 equal slices. If 3 slices are eaten, what fraction of the cake is left?
A strip of 8 rectangles, 3 of which are differentiated.
“The goal with #TapeDiagramTuesday is to practice using visual models to represent the mathematics in order to make the problem accessible to more students. Invariably the model will reveal algebraic equations that can be used.” – Duane Habecker
A field has 986 llamas and alpacas in
total. Two thirds of the llamas is
equal to three fourths of the alpacas.
How many more llamas than alpacas
are there?
What Creates Rectangles?
Students can create digital tape diagrams using almost any tool that allows them to draw/create rectangles.
FigJam to Create Digital Tape Diagrams
A fun built in feature to FigJam, digital whiteboard, is washi tape. Not only does this quickly create rectangles for students to model, they can create custom washi tape.
There are many elements to FigJam that make it an excellent choice for students to create digital tape diagrams.
Free for educators.
Infinite drawing canvas.
Easy to create text boxes for the question.
Marker tool for labeling and visualizing.
Rectangle tool.
Washi tape.
Collaborative.
Teachers and peers can comment.
Multiple students can diagram in the same space.
Control D is Duplicate
No matter your digital too, the ability to copy paste will assist students in creating digital tape diagrams.
To quickly duplicate, help students to learn the keyboard shortcut Control D. This will duplicate the rectangles quickly in the digital tool.
Amplify Polypad
Polypad is amazing for digital math manipulatives. One of the tools that will help students to create digital tape diagrams is “Number bars.” What is nice about this feature is the rectangles are labeled and scaled to size. Students simply need to drag the desired number bar onto the open canvas. Number bars can be created as a custom size by entering a number into the editable box below the 1 to 10 bars.
Tip, ensure students START by logging in. This enables saving of their work.
Polypad Features
Free.
Open canvas.
Pen tool to visualize and label.
Premade math manipulatives.
Ability to break down number bar into smaller elements.
The Importance of Logging In
In order to save, collaborate, and share digital documents almost always students need to be logged in. Most tools will allow students to login with their Google account. Get students in the habit of step 1) login to save. Step 2) Make the tape diagram.
Google Slides to Create Digital Tape Diagrams
You may notice a pattern here for possible tools. Open canvas. While the canvas of Google Slides is smaller than the others I shared, you can have multiple pages.
Features of Google Slides
Easy to locate in Google Drive.
Rectangle tool has resizeable rectangles to duplicate.
Collaborative.
Ability to add textboxes to explain reasoning.
Multiple pages.
Multiple students sharing diagrams in the same file.
GeoGebra
Not only does GeoGebra support tape diagrams, but there are already many pre-made activities ready to share with students. Search “Tape diagram” in GeoGebra and click on “GeoGebra Classroom” to start a live session.
Features of GeoGebra
Premade activities.
Interactive
See all students work in live session dashboard in real time.
Dedicated shapes. Ready-to-use rectangle tools, making it a breeze to draw your tape diagram’s foundation.
Resizing and dividing. You can easily manipulate the size and create internal divisions with just a few clicks.
Dynamic behavior: Changing values within sections automatically updates other related sections, demonstrating relationships visually.
Colors and labeling. Customize colors, add labels, and use other elements to clearly distinguish parts of your diagram.
Clean Interface: GeoGebra’s workspace maintains a clear, distraction-free environment ideal for focusing on the mathematical concepts.
Join Alice Keeler for this session for teaching with AI
Imagine having a team of teaching assistants who already know your syllabus and exactly how you like to give feedback. Join Google Certified Innovator Alice Keeler to learn how to use Google Gems to build a powerful collection of custom AI tools. We will explore how to engineer specific instructions so you can create a Grading Assistant or a Classroom Policy Manager that works for you. You will also learn how to leverage Gems shared by other educators to instantly expand your toolkit. This session is about super-powering your teaching by automating the routine tasks so you can focus on the students.
Exit this pop up by pressing escape or clicking anywhere off the pop up.