


Summarize Data with Pivot Tables
Pivot tables in Google Sheets summarize data. They are super useful for teachers and happily really simple! The first thing you need is data in a spreadsheet where information repeats. One of the easiest ways for this to happen is to use Google Forms with multiple choice options to ensure that the data is all spelled exactly the same way.
Sample Pivot Table
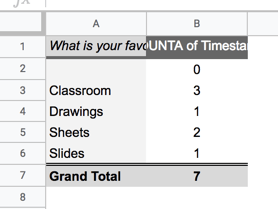
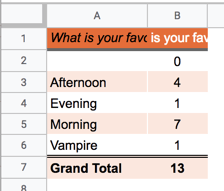
I used this Google Form to collect data that I want to summarize. Notice in the image below I used a pivot table to count how many responses there were for each option.

Updated Tables
The default option when you create a pivot table is to have it automatically update. You can turn this off, but notice in the image below that the same pivot table now summarizes 9 responses instead of 7.

Highlight Your Data
In the spreadsheet of data, highlight the columns that contain information that you want to summarize.
Data Menu
Use the Data menu to choose “Pivot table.” A new tab will automatically be created for the pivot table.

Pivot Table Editor
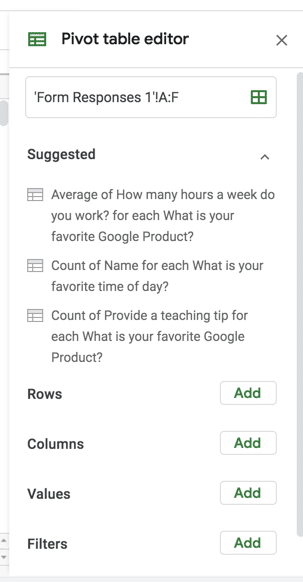
On the
Rows
Click on the “Add” button next to the word “Rows” in the sidebar to choose the column that you want to summarize.
Values
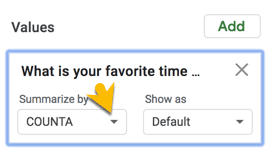
In the sidebar click on the “Add” button next to “Values” to choose what values you to summarize. Pay attention to “Summarize by.” The Google Sheets Pivot Table Editor will automatically guess how you want to summarize the values. Did you want to count or sum? Tip to double check.
Format Your Pivot Table
This is totally optional, but you may want to format your pivot table to make it easier to read. I like to center the values in the cells and make the columns a little skinnier for improved reading.
Try It
Use this spreadsheet to practice making a pivot table.