Use this Google Sheets template with Kindergarteners to explore graphing. Students use physical manipulatives to count and then represent the number in a graph.
Template
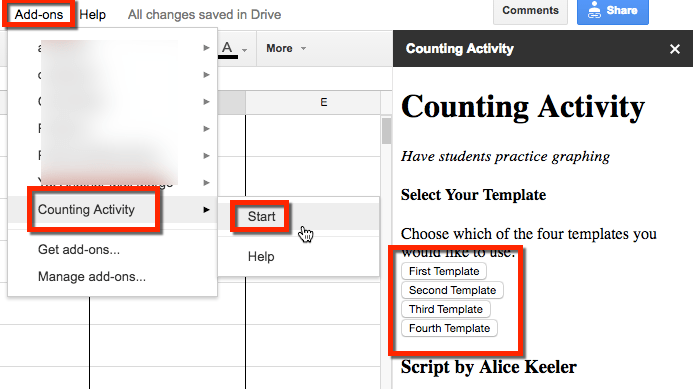
Add-on Menu
This template has 4 graphing templates. Choose the template you want to use with students. Use the Add-ons menu to choose “Counting Activity.” Press the button for the template you would like to use. The other templates will be hidden and 5 copies of the chosen template will be created.
1. Pictochart
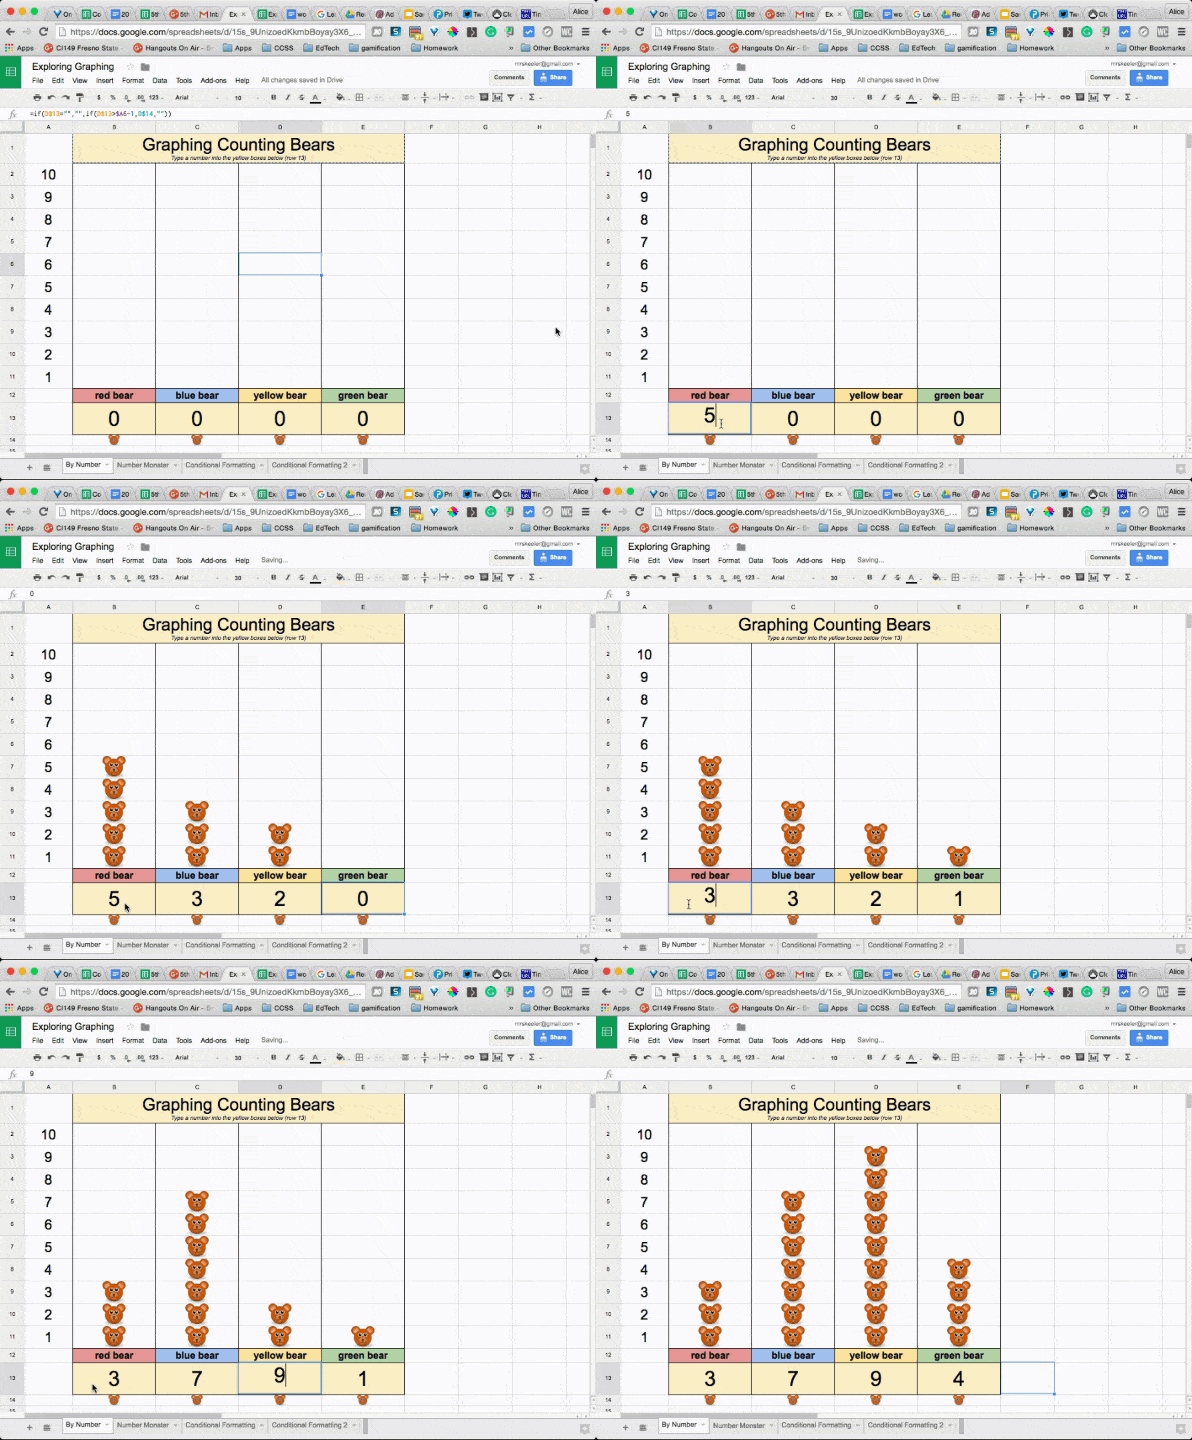
The first template allows the students to type the number of bears. Row 13 allows the students to change the default value of zero to a number 1 through 10.
Not Bears
If the students are not counting bears, adjust the template before pressing the button in the Add-on sidebar. The picture can be changed by locating an image on the internet. I used cloudclipart.com to get the pictures of the bear. Right-click on the image and choose “Copy image address.” In row 14 replace the formula =image(“URL”), replacing the previous image address with the new one you obtained.
2. Pictochart with a Warning
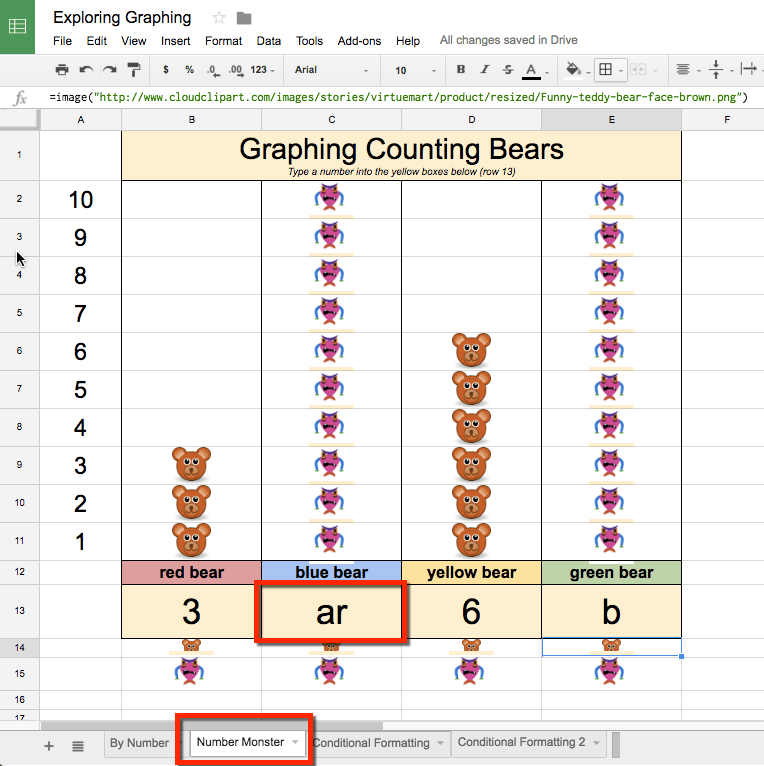
The second template is the same as the first except if students type letters instead of a number they get a warning. Monster images fill the column.
3. Mark and Create
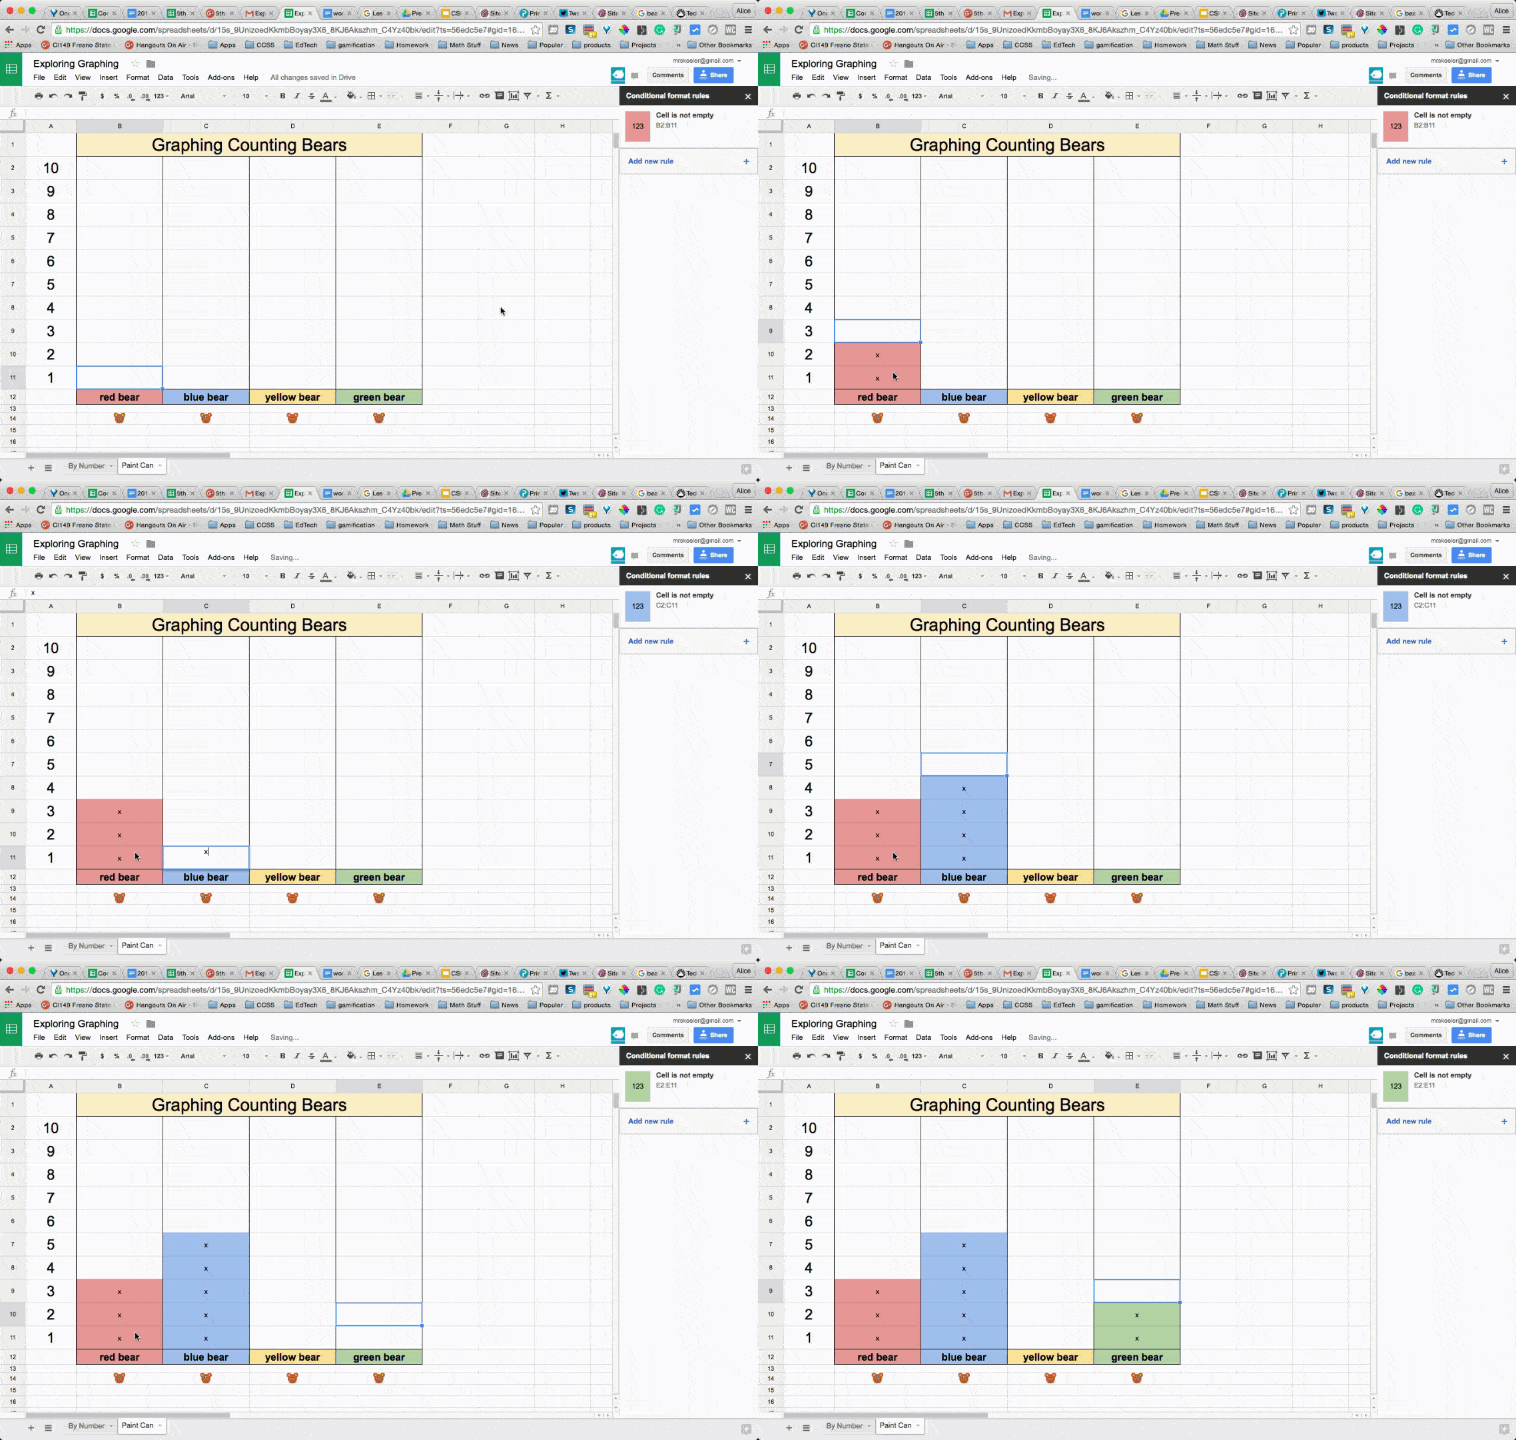
The third template has the student create the bar graph. Students can type anything into the cell to fill the cell with color. Work with students to start at the bottom in row 11. The cell shows what they used as their marker. For example, I was typing an x to fill in the cell, the x is visible.
4. Mark Invisibly and Create
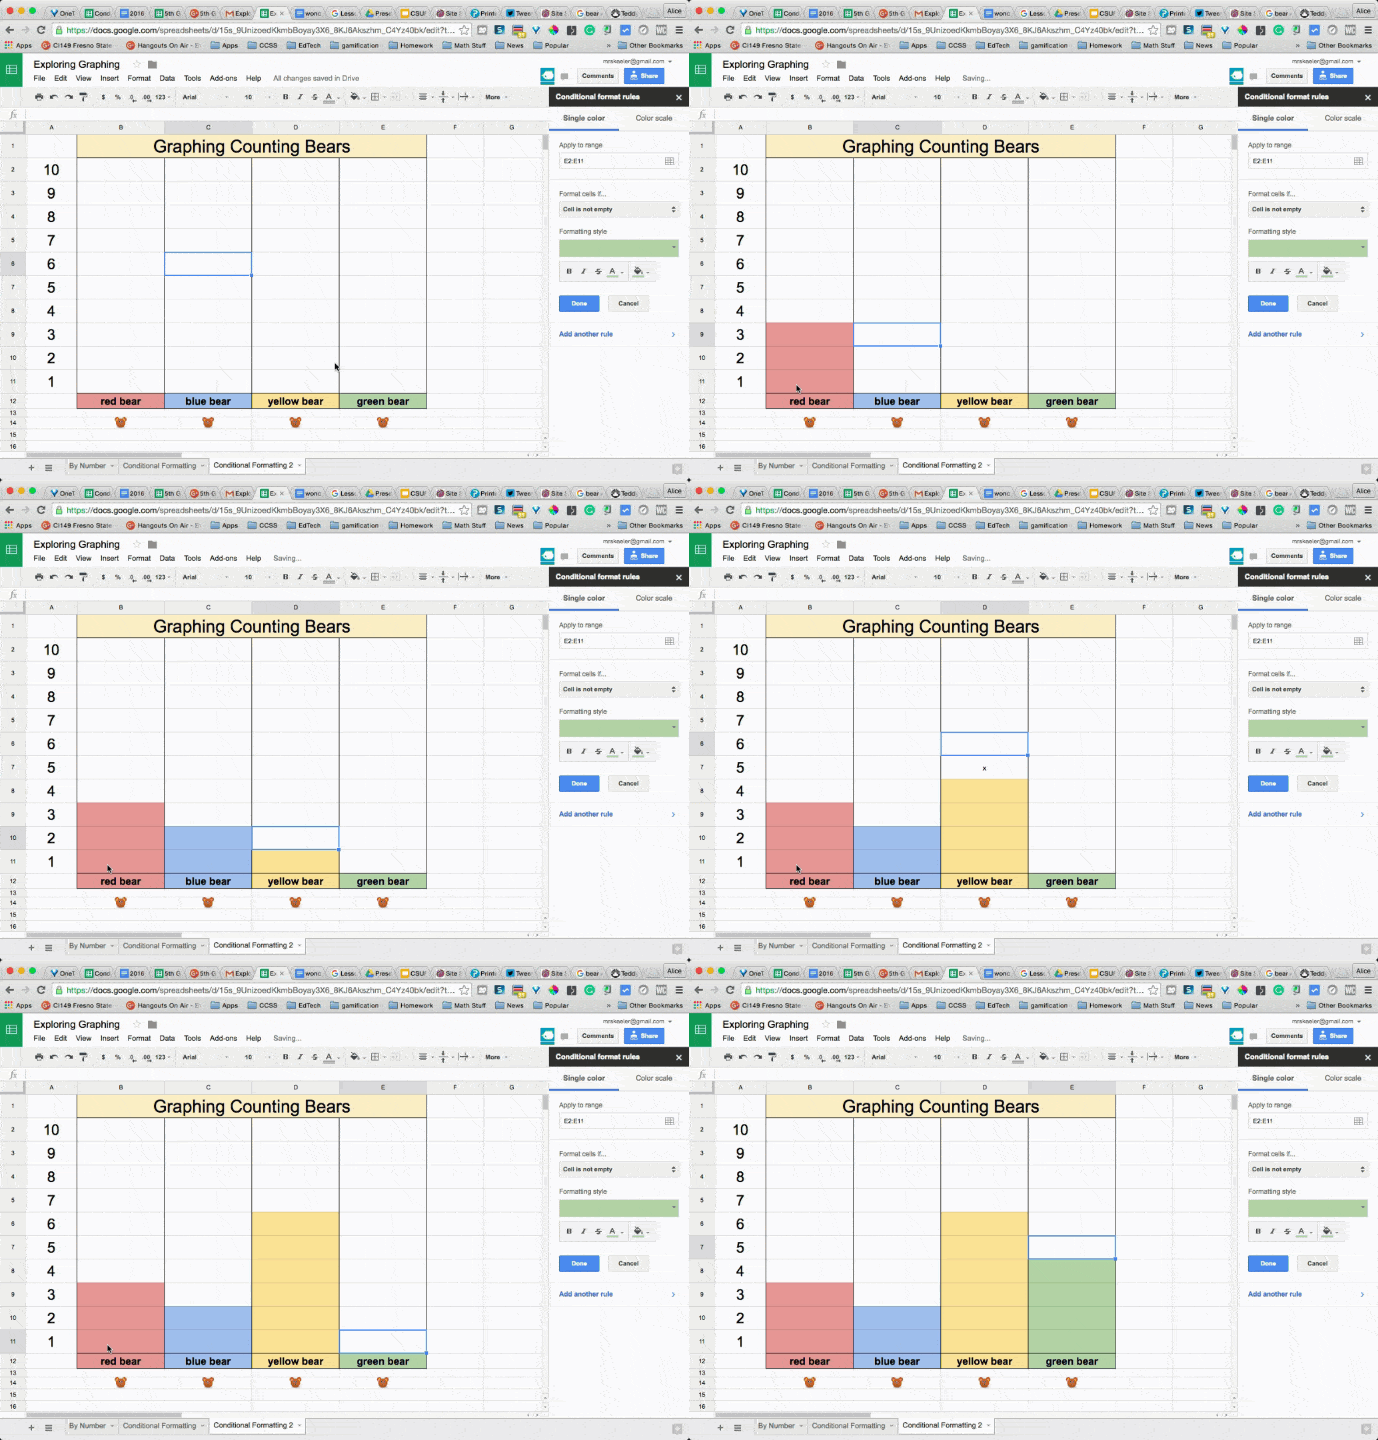
The fourth template is the same as the third template except the font color is the same as the fill color. This makes what the student used as their marker, invisible.
BONUS
5. Graph the Weather
Use this spreadsheet template to have students chart the weather.
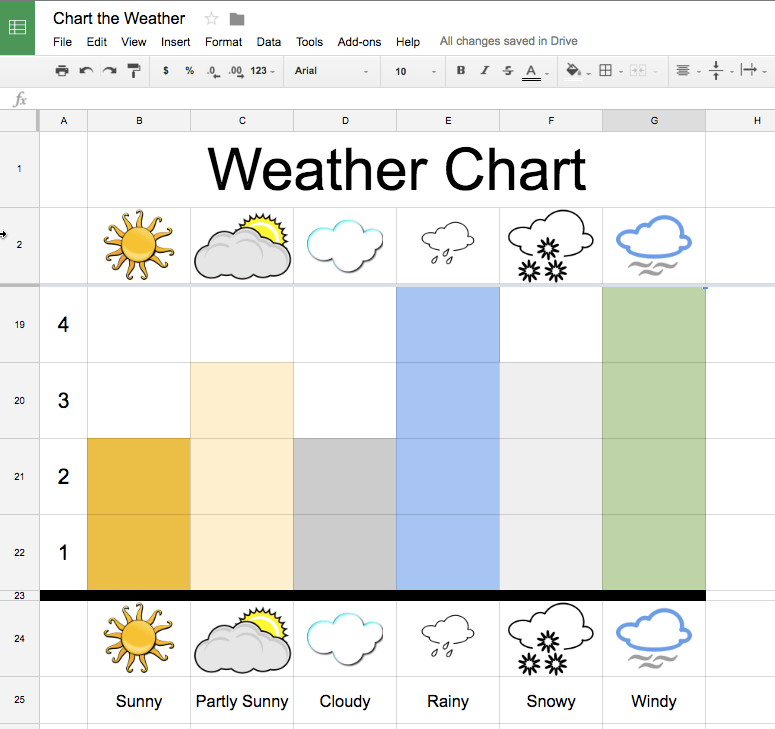
Students mark anything into the cell to create a colored block. The font and the background color match to make the mark invisible.







2 thoughts on “Exploring Graphing with Kindergarten using Google Sheets”
Hi Alice,
I’d like to use the Counting Bears graph but change the clipart. I read where you wrote to go to the Add Ons sidebar. I went to the Add Ons menu, picked Counting Activity. I clicked on Start and all I saw was to pick the template to use. When I clicked Help, nothing happened. Help!
Thank you,
Nancy
View the formulas, you’ll see where I linked to the image URL of the clip art. You can then change it.