


If you are using Google Sheets in your classroom you know that color is an essential part of the design. We naturally gravitate toward color because color is communication. It is how we organize chaos and highlight importance and direct student attention. The Add-on “AliceKeeler Select the Cells” helps you take advantage of the color you already have.

Paint Can or Conditional Formatting
The 2 ways to add color to your spreadsheet is to manually add a background color using the paint can or to automatically assign color based on the content in the cell. For example, you may want every student who has a score above 80% to have a green background, while those with less than 65% have a red background. This helps you to visually, and quickly, see who is on track and who needs additional focus.
Selecting the Color
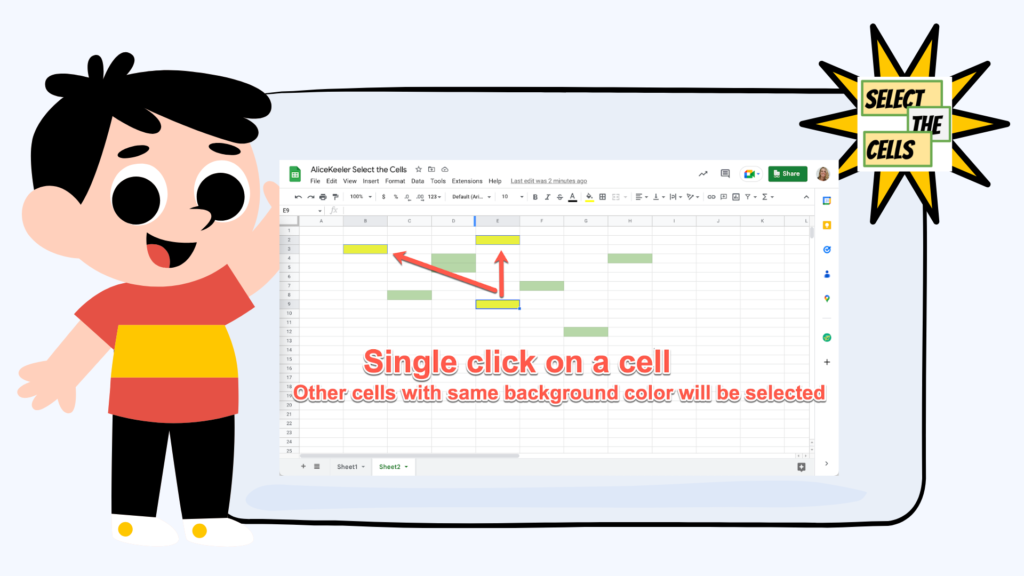
Imagine you have highlighted fifteen different cells in red across a roster of thirty students to indicate missing assignments. Now you want to clear those specific cells or change them to yellow. In a standard spreadsheet you have to hold down the Control or Command key and carefully click each one. If you miss-click you start over. It is tedious and frustrating.
AliceKeeler Select the Cells
First single click on a cell with a background color. Using the Extensions menu, choose “Highlight cells.”
Delivering high-quality content, tools, and support for reading comprehension
ReadWorks is a free, research-based website designed to support educators in teaching reading comprehension across grades K–12. It provides a rich library of high-quality, standards-aligned instructional content.
Article-A-Day, helps students build knowledge and vocabulary in just 10-minutes a day.
You can not group change the color of cells that are shaded with conditional formatting, change that in the conditional formatting menu.
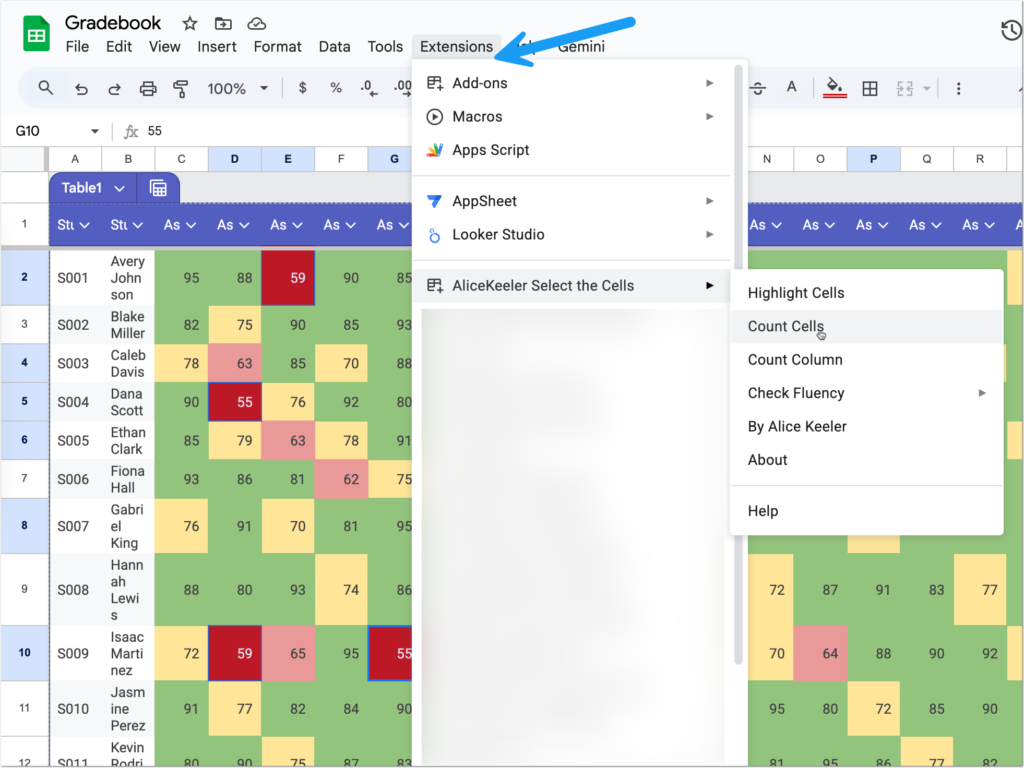
Count the Cells with the Same Color
How many students have a grade above 70%? In my gradebook example, I used conditional formatting to select each score above 70% green. Using the Select the Cells Add-on, I can select “Count Cells” to show a pop up of how many cells share that same color.
Want more help with this?

Cancel Anytime
Benefits of Premium Membership
- Supports Teacher Tech.
- Exclusive Add-ons & Templates.
- Help with student-centered teaching.
- Office hours with Alice.
- Webinars & recordings.
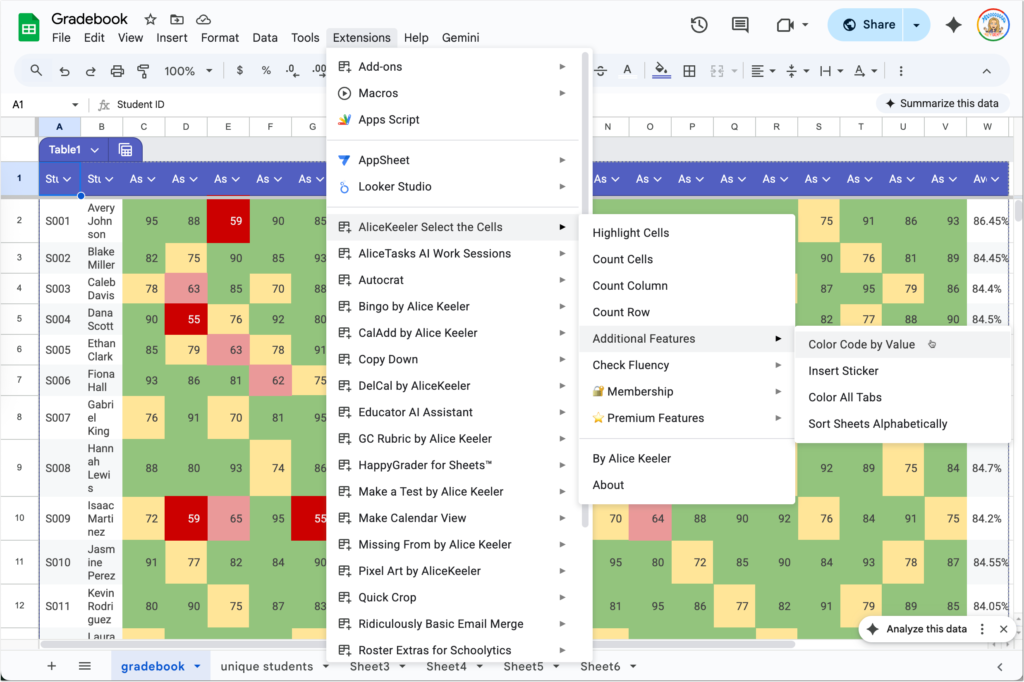
Count the Column
The “Count Cells” option counts all of the cells in the entire gradebook with a certain color. However, you may just want to know how many are in the assignment. Choose “Count Column” to count how many cells in that column contain the same color as your selected cell.
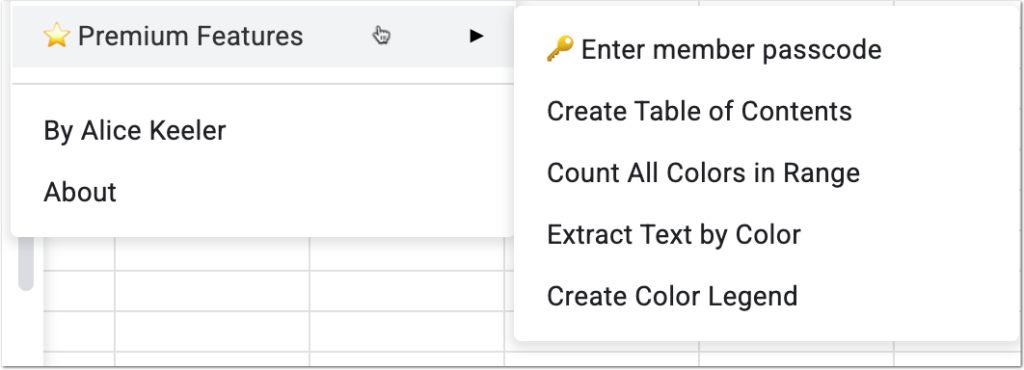
New Features
For 2026 my goal is to update all of my Add-ons to improve functionality and flow. I have added several new features to “AliceKeeler Select the Cells.”
- Color Code by Value
- Insert Sticker
- Color All Tabs
- Create Table of Contents
- Sort Sheets Alphabetically
- Count All Colors in Range
- Extract Text by Color
- Create Color Legend
Color Code by Value
When applying conditional formatting, it can be tedious to select a color for each unique value. I added a feature to help you accomplish this. Perhaps you have a Google Form that collects when students use the restroom. On the spreadsheet linked to the Form, highlight the student names and choose “Color Code by Value” in the Additional Features. This will automatically apply conditional formatting by selecting a light color background for each unique item.
Color All Tabs
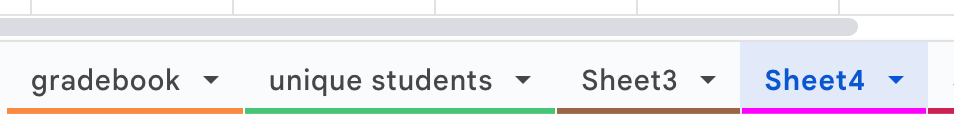
Especially when using spreadsheets with younger students, color coding your tabs can make them easier to locate. Use the “Color All Tabs” feature to assign a random color to each tab.
Sort Sheets Alphabetically
This has nothing to do with color, but is a helpful feature nonetheless. “Sort Sheets Alphabetically” is self explanatory 🙂 Dragging tabs into a particular position can be unfun, especially if you’re trying to alphabetize. Let the Add-on do it for you.
Premium Features
If you are a premium member of Teacher Tech you have access to exclusive features in my Add-ons and access to technical support. Use your premium passcode to unlock the premium features in each Add-on.
Create a Table of Contents
Insert a sheet at the front that makes a list of all of your sheet tabs and hyperlinks to the sheet.
Count All Colors in Range
How many students are in the red? How many are in the green? Highlight the range of cells first. Use the “Count All Colors in Range” feature to show a pop up of a count of the color code.
Extract Text by Color
First, highlight all of the cells you want to extract the text from. Using “Extract Text by Color” will insert a new sheet with a column per color in the range; listing below the header the contents of each cell with that color.
Create a Color Legend
I doubt you have many HEX codes memorized. This is the 6 digit pattern that defines the particular color. This option to “Create a Color Legend” will insert a sheet with a list of the colors used in your selected range and show you what color that is.
Turn Colors into Data
We often treat coloring in spreadsheets as a way to make things look pretty, but for teachers, it is actually the first step in data analysis. When you highlight a cell red, you are flagging it as important. When you color code a roster, you are categorizing information. The “Select the Cells” Add-on respects that pedagogical instinct and gives you the tools to actually use that data without the headache of manual counting or sorting. By automating the management of your spreadsheet, you free up your mental energy to focus on the students rather than the software. You stop being a data entry clerk and start being a data analyst. Here ten ways you can use these features to streamline your workflow tomorrow:
Curriculum Mapping: Use the Table of Contents to create a navigable index for your year-long lesson plan workbook so you never lose a week.
Roster Cleanup: Instantly find and remove double entries in parent email lists or student rosters with Highlight Duplicates.
Intervention Groups: Highlight struggling students in red, then use Extract Text by Color to automatically pull those names into a separate “Small Group” list.
Gradebook Analysis: Use Count Column to instantly see how many students are missing an assignment (marked in yellow) without counting manually.
Form Visualization: Apply Color Code by Value to Google Form results to instantly visualize the most common answers or trends.
Digital Binders: Use Sort Sheets Alphabetically to keep weekly agendas or dated resource tabs in perfect chronological order.
Progress Tracking: Use Insert Sticker to verify you have checked a student’s data row, leaving a visual “checked” stamp that is faster to scan than text.
Shared Data: Generate a Color Legend on shared trackers so your co-teachers or administrators immediately understand your coding system.
Event Planning: If you track field trip permission slips or t-shirt sizes by color, use Count All Colors in Range to get immediate totals for ordering. (or just use a pivot table 🙂